 |
REPORT
2021p
|
June
2026
|
- Process safety events - 2021 data

Acknowledgements
IOGP thanks those companies that have participated in the data collection programme. This Report was produced by the Safety Committee.
Feedback
IOGP welcomes feedback on our reports: publications@iogp.org
Disclaimer
Whilst every effort has been made to ensure the accuracy of the information contained in this publication, neither IOGP nor any of its Members past present or future warrants its accuracy or will, regardless of its or their negligence, assume liability for any foreseeable or unforeseeable use made thereof, which liability is hereby excluded. Consequently, such use is at the recipient’s own risk on the basis that any use by the recipient constitutes agreement to the terms of this disclaimer. The recipient is obliged to inform any subsequent recipient of such terms.
Please note that this publication is provided for informational purposes and adoption of any of its recommendations is at the discretion of the user. Except as explicitly stated otherwise, this publication must not be considered as a substitute for government policies or decisions or reference to the relevant legislation relating to information contained in it.
Where the publication contains a statement that it is to be used as an industry standard, IOGP and its Members past, present, and future expressly disclaim all liability in respect of all claims, losses or damages arising from the use or application of the information contained in this publication in any industrial application.
Any reference to third party names is for appropriate acknowledgment of their ownership and does not constitute a sponsorship or endorsement.
Copyright notice
The contents of these pages are © International Association of Oil & Gas Producers. Permission is given to reproduce this report in whole or in part provided (i) that the copyright of IOGP and (ii) the sources are acknowledged. All other rights are reserved. Any other use requires the prior written permission of IOGP.
These Terms and Conditions shall be governed by and construed in accordance with the laws of England and Wales. Disputes arising here from shall be exclusively subject to the jurisdiction of the courts of England and Wales.
|
REPORT
2021p
|
June
2026
|
- Process safety events - 2021 data
Revision history
| VERSION | DATE | AMENDMENTS |
|---|---|---|
| 1.00 | July 2025 | First release |
Contents
Contributing companies
The process safety statistics were derived from data provided by the following companies:
Introduction
In response to a number of major incidents, the oil and gas industry has identified opportunities to improve Key Performance Indicators (KPIs) for monitoring and review within management systems in order to more proactively identify and address barrier weaknesses.
IOGP Report 456 - Process Safety - Recommended Practice on Key Performance Indicators provides guidance for companies with upstream activities on Key Performance Indicators (KPI) used in managing process safety for the prevention of unplanned and uncontrolled loss of containment events. It builds on the framework and definitions included in the API Recommended Practice (RP) 754, Process Safety Indicators for the Refining and Petrochemical Industries on process safety indicators, with specific emphasis on their application to upstream oil and gas activities.
IOGP published the 3rd edition of Report 456 in May 2023. For IOGP data reporting purposes, this revised version applies to PSEs recorded from 2023 onwards.
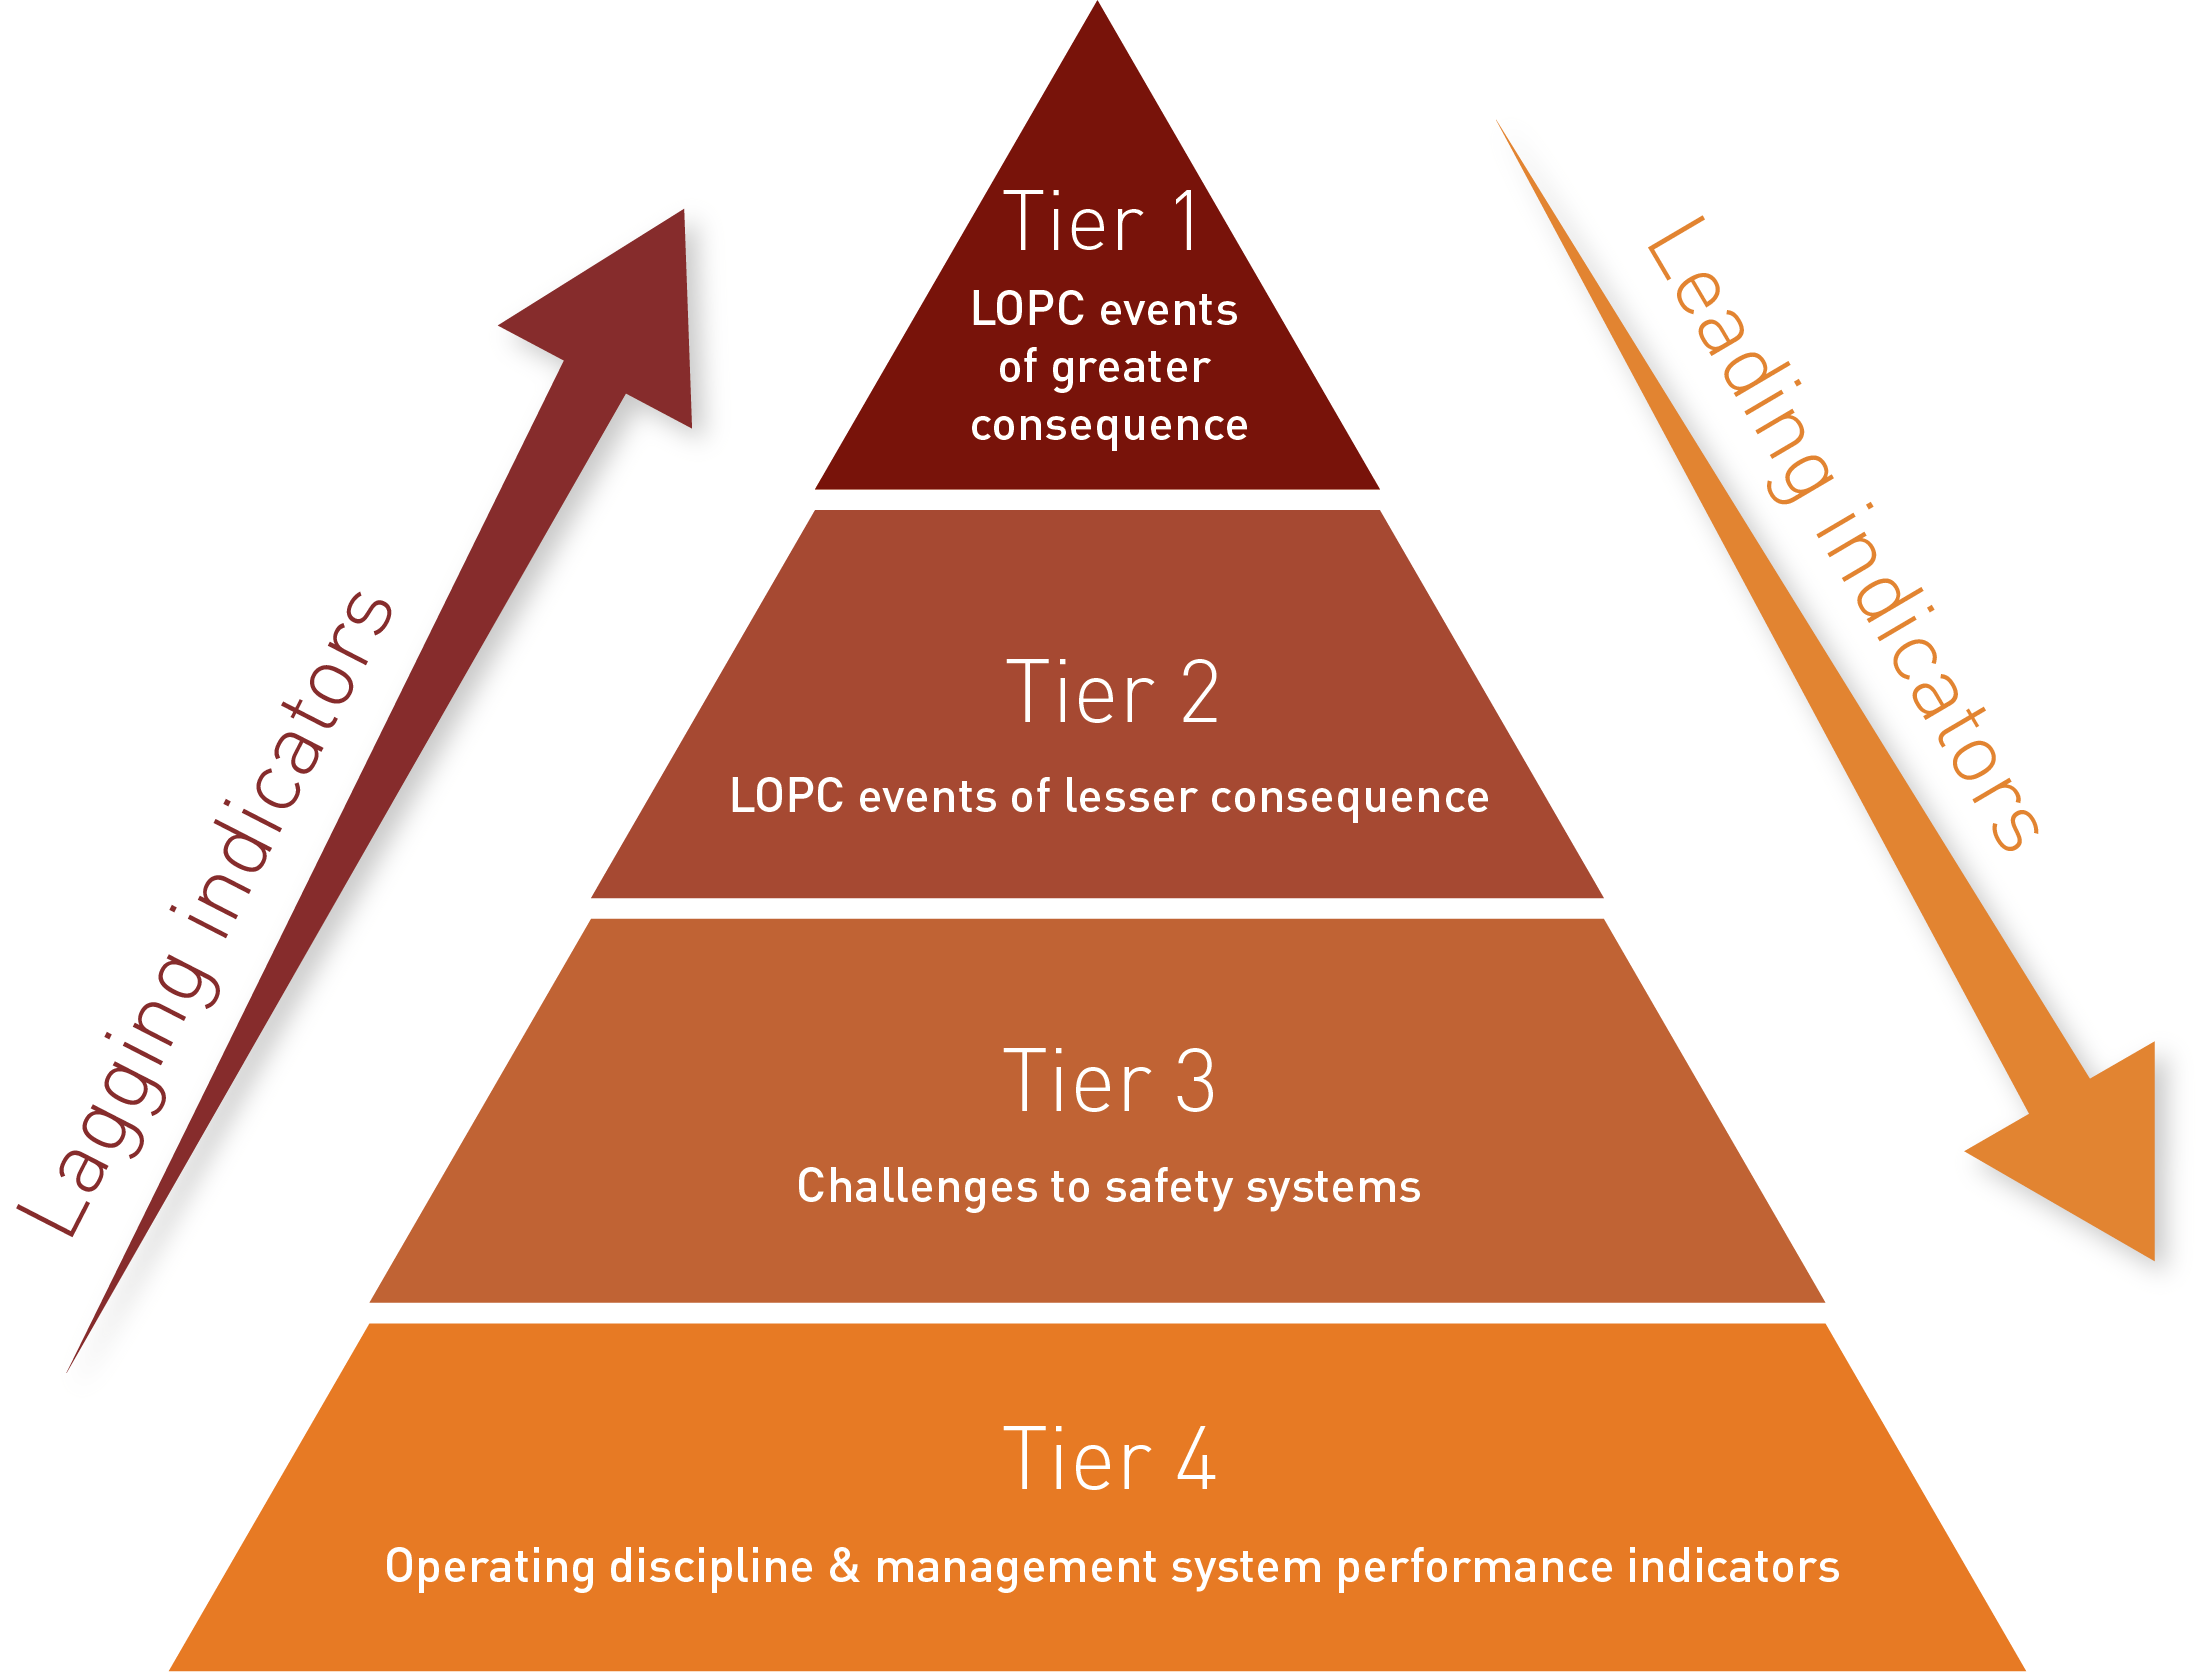
IOGP Report 456 and API RP 754 adopt a four-tier framework of KPIs which is illustrated in Figure 1.
Tiers 1 and 2 are predominantly lagging indicators related to Loss of Primary Containment (LOPC) referred to as a Process Safety Event (PSE):
- The Tier 1 KPI records events with greater consequence within the four-tier approach.
- The Tier 2 KPI records incidents with a lesser consequence.
RP 754 Tier 1 and Tier 2 KPI definitions and thresholds have been adopted by IOGP with the intent that both indicators can be applied across production and drilling operations for the industry worldwide.
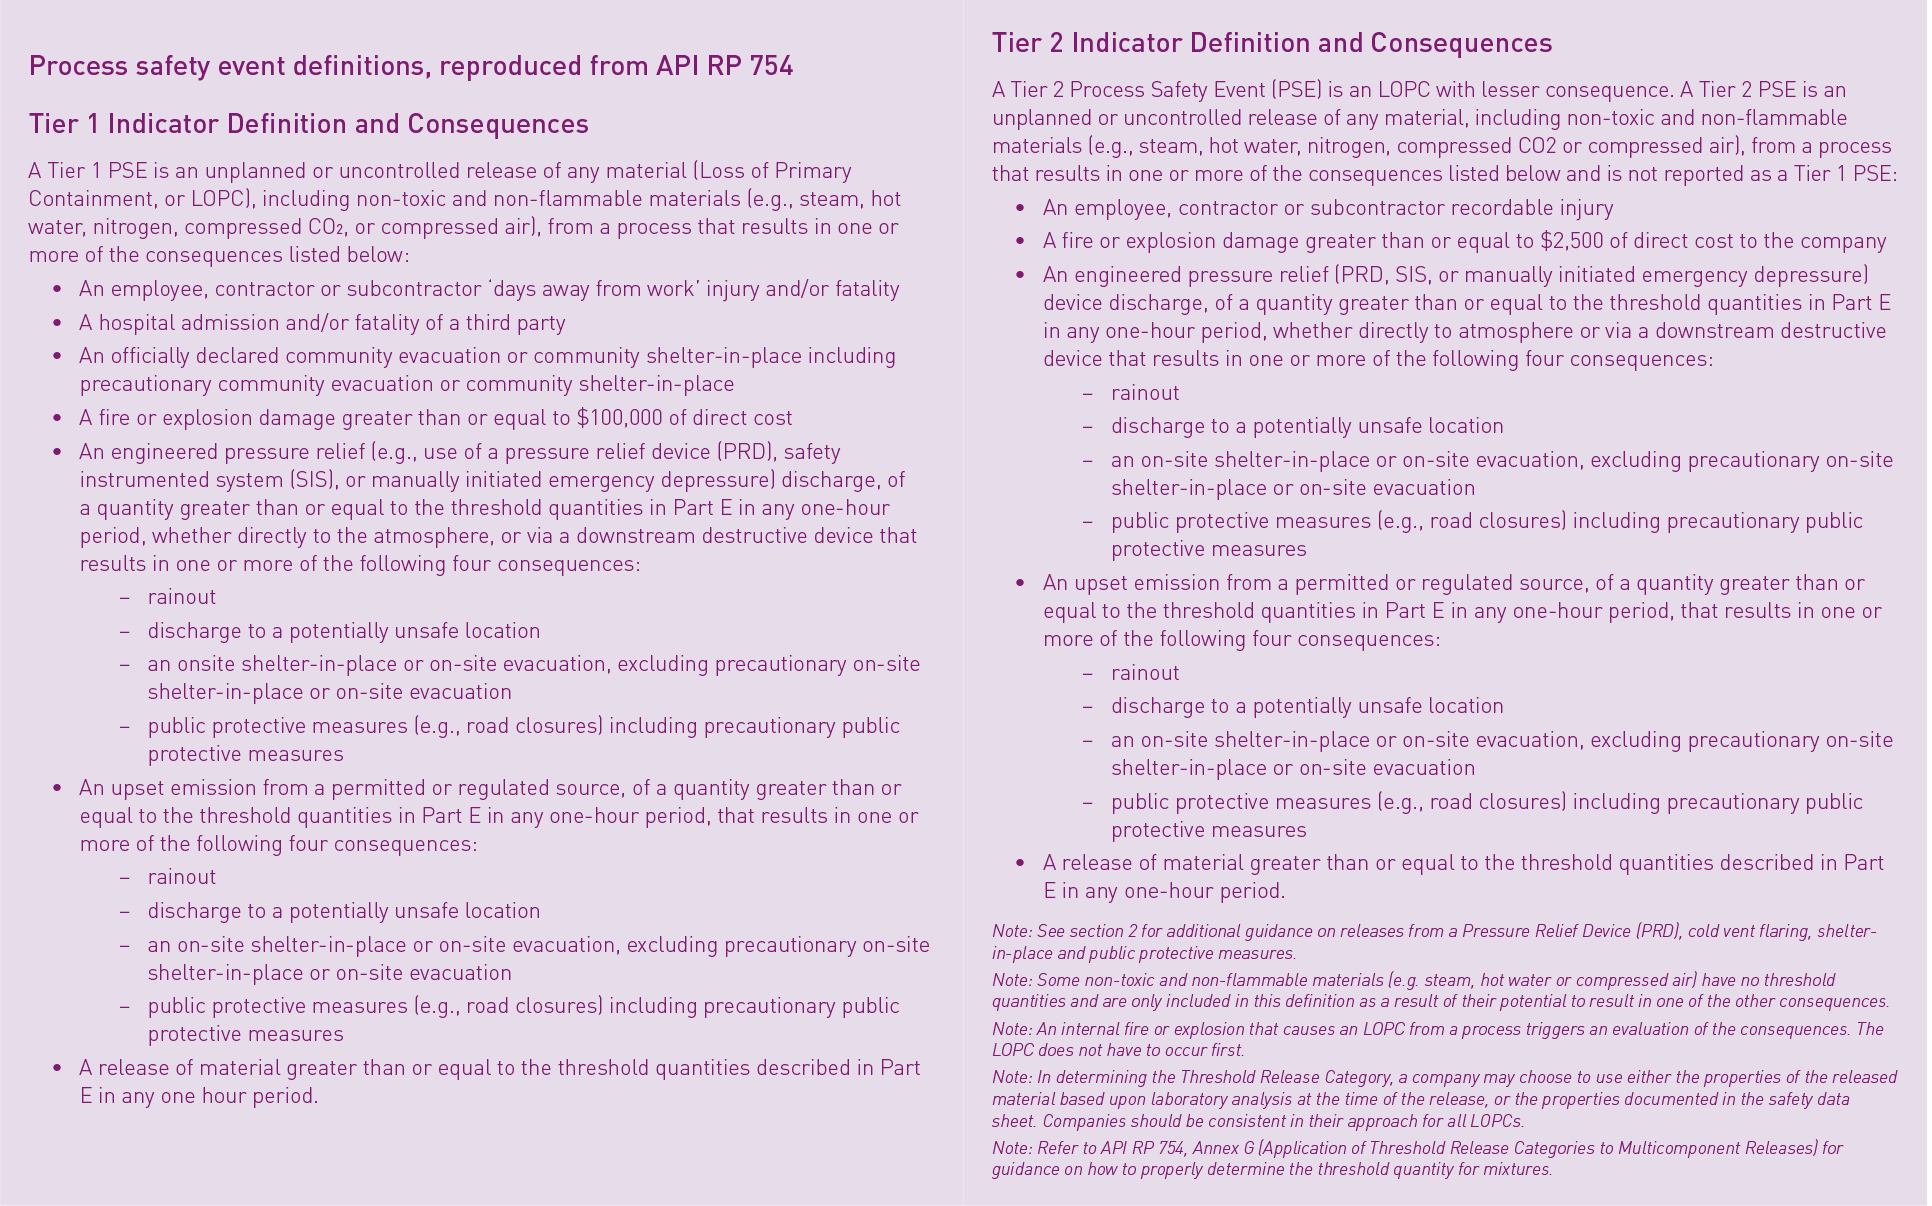
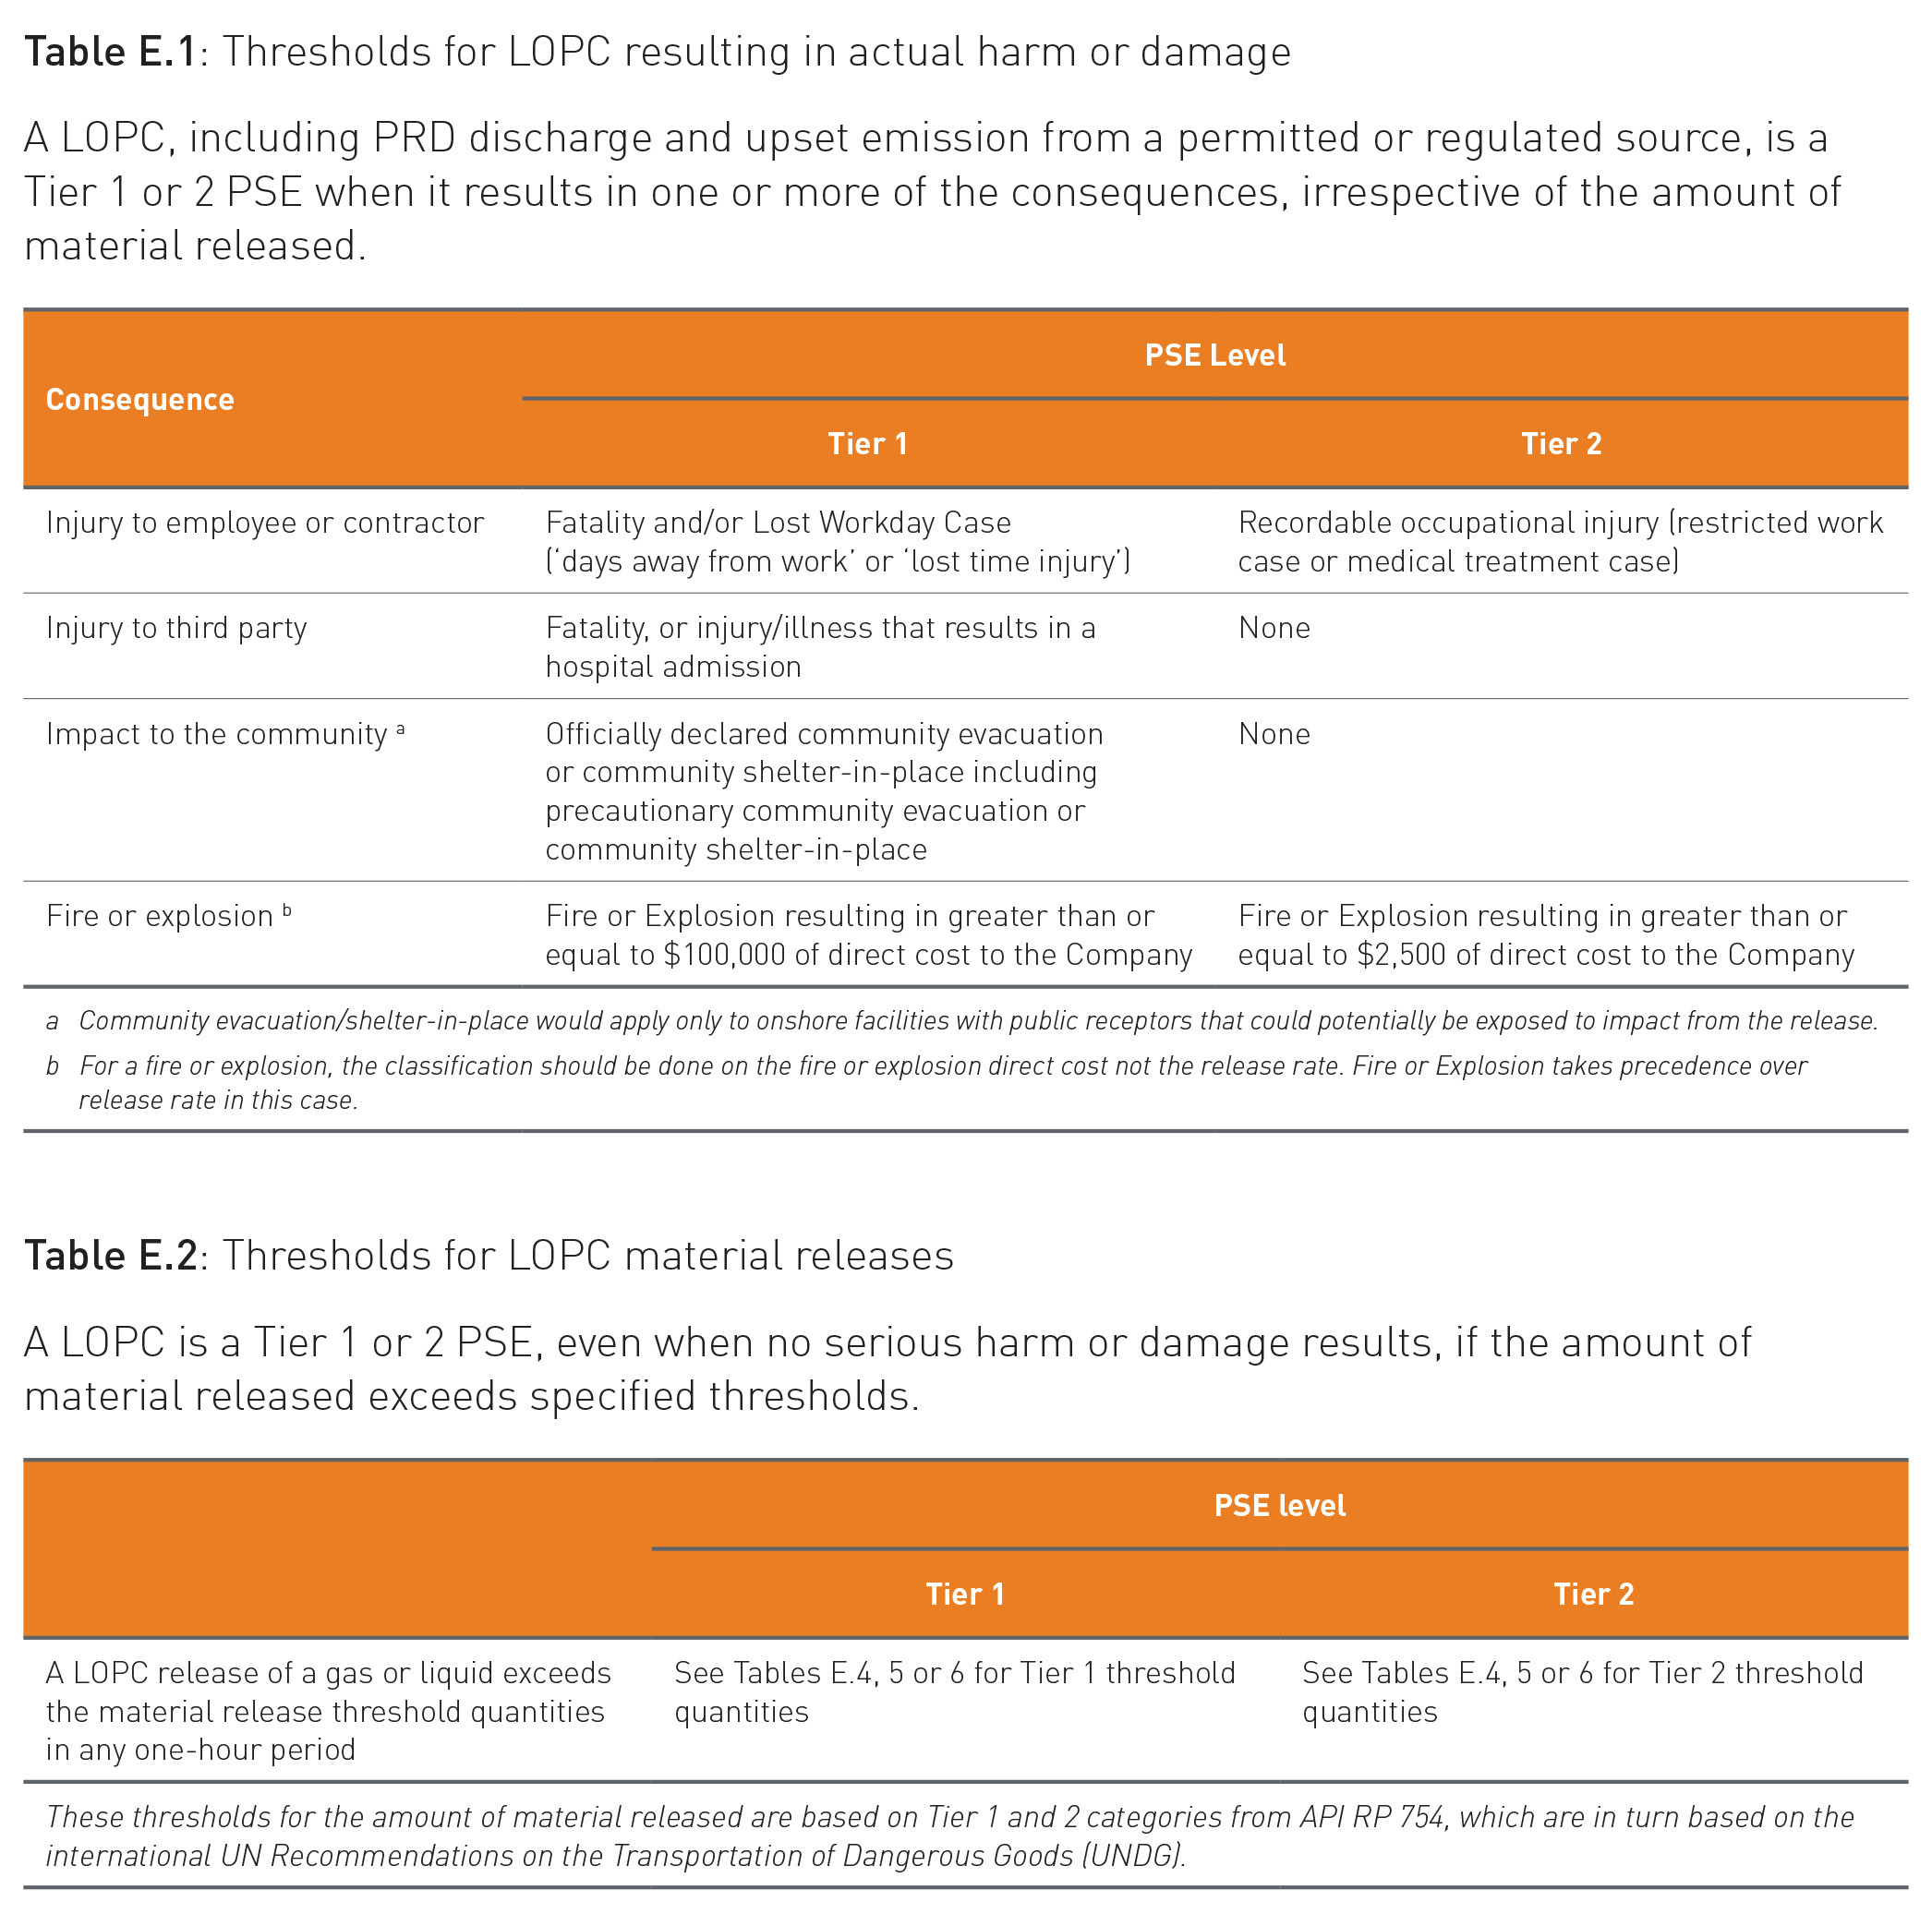
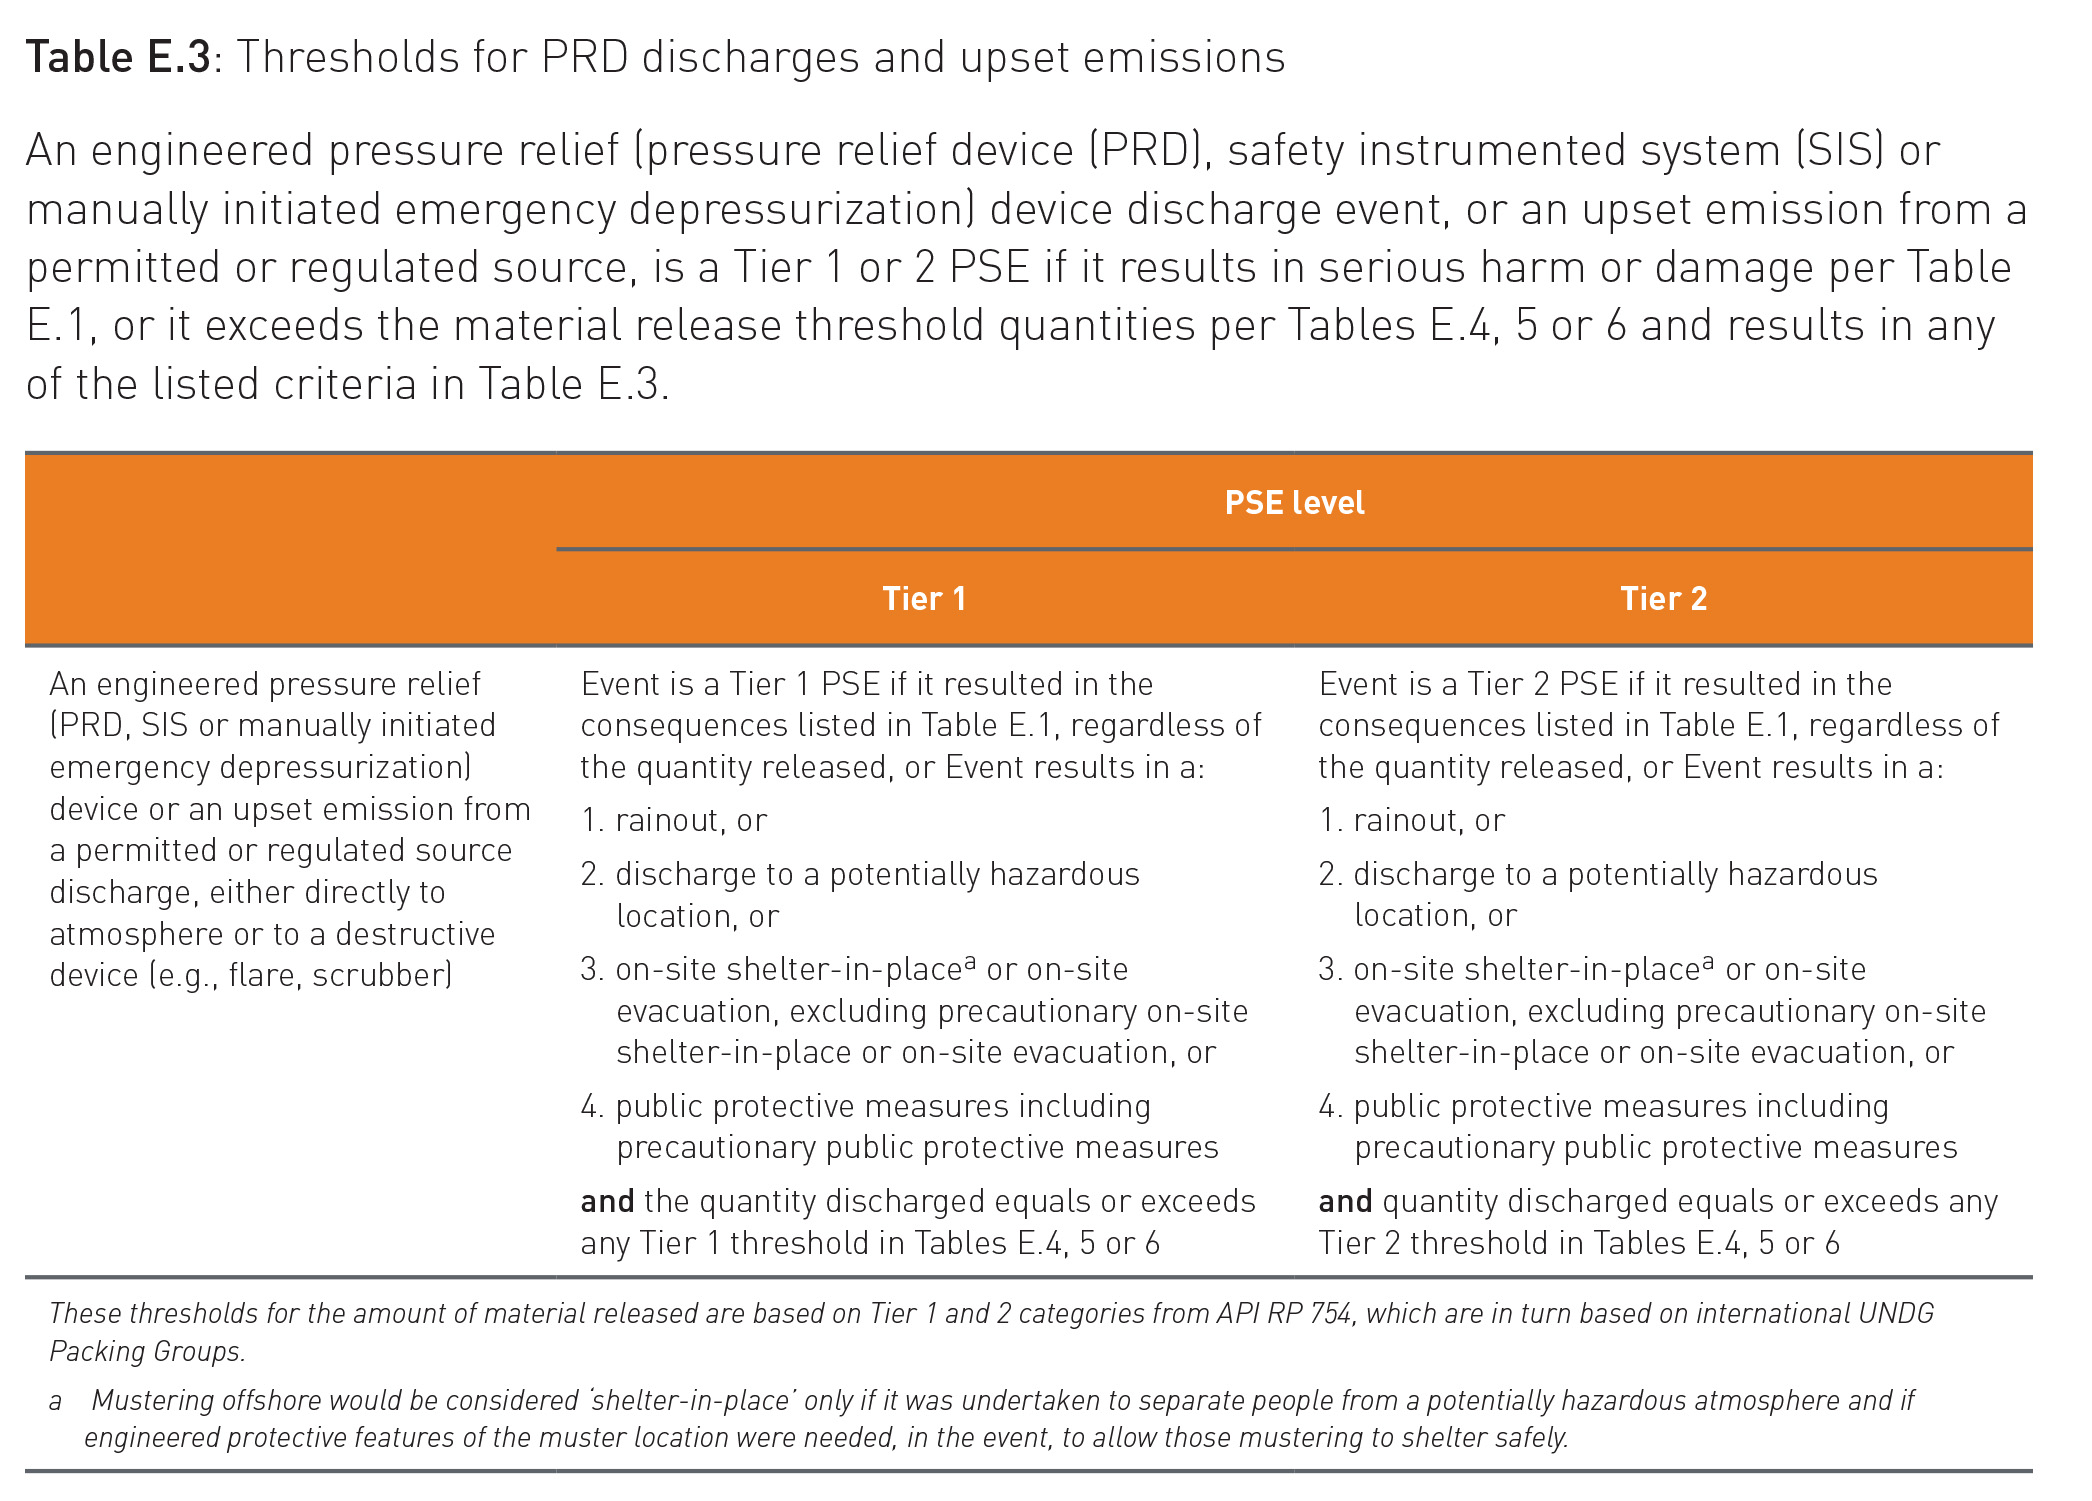
Tier 1 and Tier 2 KPIs include LOPC incidents that are reportable as Process Safety Events (PSEs) if the incident results in any of the consequences shown in Figure 2. The definitions refer to material release threshold quantities, which are published in Part E of IOGP Report 456.
Note: “days away from work” injury should be taken to be the same as the IOGP defined Lost Work Day Case (LWDC).
In this Report, 2021 data are published together with 2012-2020 data.
The Process Safety Event (PSE) data presented in this Report are based on the numbers of Tier 1 and Tier 2 PSE reported by participating IOGP Member Companies, broken down for:
- onshore and offshore
- drilling and production
- activities
- consequences
- material released
The Tier 1 and Tier 2 data presented have been normalized against reported work hours associated with drilling and production activities to provide PSE rates.
Tier 3 and Tier 4 process safety KPIs are not included in this Report as they are primarily intended for use at a company or facility level. Guidance on Tier 3 and Tier 4 indicators is available in IOGP Report 456, Part G.
Loss of primary containment (LOPC)
An unplanned or uncontrolled release of any material from primary containment, including nontoxic and non-flammable materials (e.g. steam, hot water, nitrogen, compressed CO2 or compressed air). Note: The duration of the material release is assessed from the beginning of the release to the end of the release, not from the beginning of the release to the containment or mitigation of the release. [From API RP 754]
For well operations, any unplanned or uncontrolled release to the surface (seabed or ground level) should be included. LOPC is a type of event. An unplanned or uncontrolled release is an LOPC irrespective of whether the material is released into the environment, or into secondary containment, or into other primary containment not intended to contain the material released under normal operating conditions.
Process safety [From API RP 754]
A disciplined framework for managing the integrity of hazardous operating systems and processes by applying good design principles, engineering, and operating and maintenance practices. It deals with the prevention and control of events with the potential to release hazardous materials or energy. Such releases can result in toxic effects, fire or explosion, and could ultimately result in serious injuries, property damage, lost production and environmental impact.
Primary containment
A tank, vessel, pipe, truck, rail car, or other equipment designed to keep a material within it, typically for purposes of storage, separation, processing or transfer of gases or liquids. The terms vessel and pipe are taken to include containment of reservoir fluids within the casing and wellhead valving to the surface.
Primary containment also includes closed systems that have a pressure boundary such that there is no exposure of process material to the atmosphere. Where there is a pressure boundary, liquids and vapors are recovered or controlled, and at no time is material directly in contact with the atmosphere. Examples include closed drainage or collection systems, rapid de-inventory systems, double-walled tanks, etc.
Process safety event (PSE) – IOGP reportable
An unplanned or uncontrolled release of any material including non-toxic and non-flammable materials (e.g. steam, hot water, nitrogen, compressed CO2 or compressed air) from a process, or an undesired event or condition, that under slightly different circumstances, could have resulted in a release of material. See IOGP Report 456 - Process safety - Recommended practice on Key Performance Indicators.
Secondary containment [From API RP 754]
An impermeable physical barrier specifically designed to mitigate the impact of materials that have breached primary containment (i.e., an LOPC). Secondary containment systems include, but are not limited to tank dikes, curbing around process equipment, open drainage collection systems, trenches, pits, open sumps, the outer wall of open top double-walled tanks, etc.
A summary of 2012-2021 data can be found in Appendix B.
A glossary of terms related to Process Safety Events can be found in Appendix D.
Data collection
Participating IOGP Member Companies were asked to report the number of offshore and onshore Tier 1 and Tier 2 PSEs for both drilling and production, consequences relating to Tier 1 and Tier 2 PSEs, and additional information about the material released and the operational activities at the time of the release. Note that a single PSE can result in multiple consequences, so the total number of consequences reported will equal or exceed the total number of PSEs.
Information was also requested on fatalities that resulted from PSE, i.e., the number of PSEs that resulted in one or more fatalities, as well as the actual number of fatalities (employees, contractors, or third parties).
Narrative event descriptions
Narrative descriptions of Tier 1 PSE, as well as fatal incidents and high potential events that have been collected as part of the annual safety performance indicators report and that are process safety events or process safety related, are published as IOGP Report 2021pfh - Safety performance indicators – Process safety events – 2021 data – Tier 1 PSE, fatal incident, and high potential event reports . Process safety related events are those where there are significant process safety lessons learned but the criteria for PSE is not met, e.g., equipment not connected to the process. The intention is to enable feedback on lessons learned from events and to help organizations categorize process safety events.
The narrative descriptions of fatal incidents and high potential events are submitted separately to the process safety event data published in this Report, and Tier 1 PSE narratives were not provided for all reported Tier 1 PSE. Therefore, there can be no direct correlation between the narratives and the data published in this Report.
Descriptions and lessons learned for Tier 1 PSE are available at https://data.iogp.org/ProcessSafety/Tier1PSE/. Fatal incidents that are also Tier 1 PSE are available at https://data.iogp.org/ProcessSafety/FatalIncidents/. High potential events that are PSE or PSE related are available at https://data.iogp.org/ProcessSafety/HighPotentialEvents/.
Descriptions and lessons learned for all reported events that had fatal consequences for company or contractor employees are available at https://data.iogp.org/Safety/FatalIncidents/. High potential events are available at https://data.iogp.org/Safety/HighPotentialEvents/.
Normalization
Tier 1 and Tier 2 PSE have been normalized against work hours associated with process safety events using the following formula for the PSE Rate. Refer to IOGP Report 456, Part C, for further information.
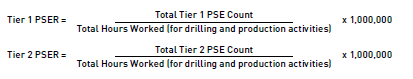
Data are only included for normalized results where both work hours and process safety event data are reported for the data set and work function.
Scope of reporting and data validation
The data requested from participating IOGP Member Companies are published in an annual user guide, which contains definitions and the scope of the safety data submission. This document is available from the IOGP public website.
The safety data submission process is used for the collection of data relating to safety performance, process safety performance, and motor vehicle crashes. The IOGP safety database has built-in data validation requirements and each company data submission is validated by the IOGP Secretariat and the work group (Safety Committee, Subcommittee, or Expert Group) responsible for the data set, in accordance with the IOGP data collection and reporting procedure. Any communication with reporting companies is conducted by the IOGP Secretariat and any data validated by an IOGP workgroup is blind coded to preserve the anonymity of the reporting companies.
A self-assessment questionnaire is included within the data submission process to determine the alignment between the requested data and the company submissions. The information provided in this questionnaire is also used in the validation process. Data that appear to be incorrect and that cannot be confirmed by the submitting company as correct may be excluded from the data set at the discretion of the Secretariat.
The scope of data included within this Report is detailed in Appendix A.
Data series
Other IOGP data Reports published annually include:
- Aviation Safety Data
- Environmental Performance Indicators
- Health Performance Indicators
- Motor Vehicle Crash Data
- Safety Performance Indicators Data
These are available from the IOGP data website at https://data.iogp.org/.
1. 2021 results
1.1 Tier 1 and Tier 2 PSE
The total number of Tier 1 and Tier 2 process safety events reported for 2012-2021 and the normalized rates are shown in Figure 3, Figure 5, and Table 1. The data include onshore and offshore activities related to production and drilling operations.
47 companies contributed PSE data in 2021 (vs. 44 in 2020, 47 in 2019) (see Table 2 and Appendix A). This is in comparison with 50 companies contributing to the safety performance indicators database in 2021 (48 in 2020, 48 in 2019).
It should be noted that participation in the IOGP annual collection of safety and process safety performance data is voluntary, and not all Member Companies participate in each specific data set. In addition to the PSE data presented here, a further 3 Tier 1 PSE with fatal outcomes were reported as part of the safety performance data set (IOGP Reports 2024s and 2024sf). Narrative descriptions for these additional fatal Tier 1 PSE have been included in IOGP Report 2024pfh for the purposes of learning. They are not included in the main data analysis or performance metrics within this report, as the reporting companies did not participate in the specific PSE data collection, but they are included in Sections 1.5 (fatal incident causal factors) and 4.3 (injury as consequence). These events in 2024 include:
- 1 Tier 1 PSE in Gabon resulting in 6 fatalities
- 2 Tier 1 PSE in Mexico, one resulting in 1 fatality and one resulting in 3 fatalities
The data presented in Figure 5 have been normalized using the company-reported work hours associated with drilling and production operations.
Where companies have not provided work hours for the drilling and production functions specifically, their reported PSEs and overall work hours have been excluded from the normalized analysis shown in Figure 5. See Tables B.1 (Tier 1 data) and B.2 (Tier 2 data).
| Year | Number of PSE | Number of PSE for normalized results* | PSE rate (PSE per million work hours)* | |||
|---|---|---|---|---|---|---|
| Tier 1 | Tier 2 | Tier 1 | Tier 2 | Tier 1 | Tier 2 | |
| 2015 | 254 | 795 | 216 | 700 | 0.14 | 0.44 |
| 2016 | 192 | 715 | 176 | 444 | 0.16 | 0.44 |
| 2017 | 192 | 617 | 187 | 558 | 0.13 | 0.39 |
| 2018 | 256 | 607 | 238 | 555 | 0.16 | 0.39 |
| 2019 | 261 | 795 | 246 | 729 | 0.14 | 0.42 |
| 2020 | 184 | 536 | 173 | 486 | 0.12 | 0.35 |
| 2021 | 193 | 622 | 193 | 614 | 0.12 | 0.38 |
| 2022 | 182 | 563 | 176 | 556 | 0.12 | 0.37 |
| 2023 | 218 | 620 | 217 | 607 | 0.11 | 0.31 |
| 2024 | 188 | 725 | 185 | 638 | 0.08 | 0.29 |
*Excludes PSE where no related drilling or production work hours were reported.
Excludes Tier 1 and 2 PSE as a result of sabotage, see Table 3 for sabotage data.
In 2021, reported PSE represented approximately 97% of the drilling and production work hours in the 2021 IOGP safety database, i.e., out of 1,655 million hours (99% in 2020, 99% in 2019, see Table A.1).
| Year | Number of companies reporting PSE | Number of data sets where PSE data reported | Related work hours (millions)* | ||||
|---|---|---|---|---|---|---|---|
| Overall | Tier 1 | Tier 2 | Tier 1 | Tier 2 | Tier 1 | Tier 2 | |
| 2011 | 26 | 26 | 20 | 322 | 270 | 971 | 913 |
| 2012 | 32 | 32 | 29 | 428 | 426 | 1,197 | 1,160 |
| 2013 | 39 | 39 | 38 | 378 | 375 | 1,326 | 1,311 |
| 2014 | 44 | 44 | 42 | 571 | 547 | 1,639 | 1,631 |
| 2015 | 44 | 44 | 44 | 589 | 586 | 1,522 | 1,588 |
| 2016 | 39 | 39 | 39 | 487 | 481 | 1,096 | 1,015 |
| 2017 | 43 | 43 | 43 | 507 | 513 | 1,450 | 1,443 |
| 2018 | 42 | 42 | 41 | 548 | 533 | 1,495 | 1,440 |
| 2019 | 47 | 47 | 47 | 508 | 507 | 1,712 | 1,724 |
| 2020 | 44 | 44 | 43 | 346 | 346 | 1,406 | 1,406 |
| 2021 | 47 | 47 | 47 | 363 | 363 | 1,604 | 1,604 |
| 2022 | 47 | 47 | 47 | 365 | 365 | 1,509 | 1,509 |
| 2023 | 52 | 52 | 52 | 355 | 355 | 1,939 | 1,939 |
| 2024 | 48 | 48 | 48 | 321 | 322 | 2,234 | 2,234 |
Note: PSE Data Set: A set of data with distinct company, country, and location (onshore/offshore) where PSE data have been entered (i.e., not blank).
1.2. Sabotage/wilful damage
Process safety events as a result of sabotage or wilful damage were reported for 2012-2021, but were not included in the PSE totals or normalized rates since they are a specific subset of PSE.
| Year | Number of PSE related to sabotage or wilful damage | |
|---|---|---|
| Tier 1 | Tier 2 | |
| 2015 | 52 | 20 |
| 2016 | 18 | 4 |
| 2017 | 13 | 0 |
| 2018 | 14 | 5 |
| 2019 | 20 | 3 |
| 2020 | 4 | 4 |
| 2021 | 14 | 22 |
| 2022 | 4 | 3 |
| 2023 | 22 | 3 |
| 2024 | 6 | 1 |
14 Tier 1 PSE related to sabotage or wilful damage were reported in 2021. All 14 occurred onshore. All 14 were associated with production operations and resulted in material release.
None of the sabotage/wilful damage PSE reported to date have involved fatalities.
1.3 Onshore and offshore
The Tier 1 and Tier 2 data presented below represent production and drilling PSEs and associated work hours.
1.4 Tier 1 PSE causal factors
Allocation of ‘causal factors’ to Tier 1 process safety events was introduced as part of the 2014 data request.
To standardize the response, an IOGP list of causal factors and a glossary was provided to the Member Companies as part of the IOGP User Guide. The causal factors list is divided into two sections:
- People (Acts) classifications usually involve either the actions of a person or actions which were required but not carried out or were incorrectly performed. There are four major categories of actions, with an additional level of detail under each of the major categories.
- Process (Conditions) classifications usually involve some type of physical hazard or organizational aspect out of the control of the individual. There are five major classification categories, with an additional level of detail under each of the major categories.
Tier 1 PSE that were the result of sabotage or wilful damage are included in the causal factors analysis.
| Causal factor group | 2014 | 2015 | 2016 | 2017 | 2018 | 2019 | 2020 | 2021 |
|---|---|---|---|---|---|---|---|---|
| PEOPLE (ACTS) | 72 | 66 | 94 | 50 | 59 | 85 | 104 | 55 |
| PROCESS (CONDITIONS) | 313 | 319 | 370 | 250 | 288 | 280 | 356 | 210 |
The causal factors assigned to Tier 1 PSE are shown below. The highlighted content indicates the top 10 causal factors assigned to Tier 1 PSE in 2021 compared with the previous 7 years.
| Causal factors assigned to Tier 1 PSE | 2014 | 2015 | 2016 | 2017 | 2018 | 2019 | 2020 | 2021 |
|---|---|---|---|---|---|---|---|---|
| PROCESS (CONDITIONS) : Tools, Equipment, Materials and Products : Inadequate maintenance/inspection/testing | 60 | 65 | 58 | 68 | 47 | 54 | 59 | 50 |
| PROCESS (CONDITIONS) : Tools, Equipment, Materials and Products : Inadequate design/specification/management of change | 42 | 42 | 63 | 27 | 34 | 50 | 54 | 33 |
| PROCESS (CONDITIONS) : Organizational : Inadequate hazard identification or risk assessment | 47 | 33 | 46 | 22 | 28 | 24 | 46 | 24 |
| PROCESS (CONDITIONS) : Tools, Equipment, Materials and Products : Inadequate/defective tools/equipment/materials/products | 39 | 48 | 44 | 24 | 63 | 37 | 49 | 21 |
| PROCESS (CONDITIONS) : Organizational : Inadequate work standards/procedures | 30 | 32 | 40 | 22 | 25 | 28 | 42 | 20 |
| PEOPLE (ACTS) : Following Procedures : Deviation unintentional (by individual or group) | 23 | 8 | 33 | 11 | 15 | 26 | 18 | 12 |
| PROCESS (CONDITIONS) : Organizational : Inadequate training/competence | 21 | 15 | 23 | 13 | 15 | 10 | 20 | 10 |
| PROCESS (CONDITIONS) : Organizational : Inadequate communication | 9 | 11 | 15 | 10 | 10 | 11 | 20 | 9 |
| PROCESS (CONDITIONS) : Protective Systems : Inadequate/defective guards or protective barriers | 13 | 20 | 14 | 16 | 8 | 16 | 17 | 9 |
| PROCESS (CONDITIONS) : Organizational : Inadequate supervision | 17 | 11 | 20 | 10 | 12 | 10 | 10 | 9 |
| PROCESS (CONDITIONS) : Work Place Hazards : Storms or acts of nature | 3 | 9 | 11 | 3 | 17 | 11 | 4 | 9 |
| PEOPLE (ACTS) : Inattention/Lack of Awareness : Improper decision making or lack of judgment | 13 | 16 | 12 | 8 | 11 | 10 | 17 | 8 |
| PROCESS (CONDITIONS) : Protective Systems : Inadequate/defective warning systems/safety devices | 10 | 9 | 17 | 18 | 14 | 20 | 13 | 6 |
| PEOPLE (ACTS) : Inattention/Lack of Awareness : Lack of attention/distracted by other concerns/stress | 7 | 10 | 7 | 6 | 5 | 13 | 10 | 6 |
| PEOPLE (ACTS) : Following Procedures : Deviation intentional (by individual or group) | 1 | 3 | 3 | 0 | 3 | 4 | 1 | 5 |
| PEOPLE (ACTS) : Use of Protective Methods : Failure to warn of hazard | 3 | 3 | 9 | 7 | 3 | 5 | 11 | 4 |
| PEOPLE (ACTS) : Use of Tools, Equipment, Materials and Products : Improper use/position of tools/equipment/materials/products | 9 | 5 | 5 | 4 | 4 | 6 | 10 | 4 |
| PEOPLE (ACTS) : Use of Tools, Equipment, Materials and Products : Servicing of energized equipment/inadequate energy isolation | 2 | 4 | 6 | 2 | 1 | 6 | 9 | 3 |
| PROCESS (CONDITIONS) : Work Place Hazards : Hazardous atmosphere (explosive/toxic/asphyxiant) | 3 | 4 | 4 | 9 | 4 | 3 | 4 | 3 |
| PROCESS (CONDITIONS) : Protective Systems : Inadequate security provisions or systems | 0 | 1 | 2 | 1 | 0 | 2 | 2 | 3 |
| PEOPLE (ACTS) : Use of Protective Methods : Inadequate use of safety systems | 3 | 3 | 7 | 2 | 5 | 1 | 2 | 3 |
| PROCESS (CONDITIONS) : Protective Systems : Inadequate/defective Personal Protective Equipment | 2 | 1 | 4 | 0 | 5 | 0 | 1 | 3 |
| PEOPLE (ACTS) : Following Procedures : Improper position (in the line of fire) | 2 | 5 | 1 | 4 | 4 | 6 | 6 | 2 |
| PEOPLE (ACTS) : Use of Protective Methods : Equipment or materials not secured | 2 | 3 | 5 | 1 | 2 | 4 | 5 | 2 |
| PEOPLE (ACTS) : Use of Protective Methods : Personal Protective Equipment not used or used improperly | 3 | 1 | 1 | 2 | 2 | 1 | 1 | 2 |
| PEOPLE (ACTS) : Use of Protective Methods : Disabled or removed guards, warning systems or safety devices | 3 | 4 | 2 | 3 | 2 | 0 | 1 | 2 |
| PEOPLE (ACTS) : Following Procedures : Improper lifting or loading | 0 | 0 | 2 | 0 | 2 | 1 | 4 | 1 |
| PROCESS (CONDITIONS) : Organizational : Poor leadership/organizational culture | 9 | 6 | 2 | 2 | 1 | 0 | 4 | 1 |
| PEOPLE (ACTS) : Following Procedures : Work or motion at improper speed | 1 | 0 | 0 | 0 | 0 | 0 | 2 | 1 |
| PROCESS (CONDITIONS) : Organizational : Failure to report/learn from events | 4 | 10 | 4 | 3 | 4 | 4 | 10 | 0 |
| PEOPLE (ACTS) : Inattention/Lack of Awareness : Acts of violence | 0 | 0 | 0 | 0 | 0 | 0 | 4 | 0 |
| PEOPLE (ACTS) : Following Procedures : Overexertion or improper position/posture for task | 0 | 0 | 0 | 0 | 0 | 1 | 2 | 0 |
| PEOPLE (ACTS) : Inattention/Lack of Awareness : Fatigue | 0 | 1 | 1 | 0 | 0 | 1 | 1 | 0 |
| PROCESS (CONDITIONS) : Work Place Hazards : Inadequate surfaces, floors, walkways or roads | 2 | 2 | 2 | 1 | 1 | 0 | 1 | 0 |
| PROCESS (CONDITIONS) : Work Place Hazards : Congestion, clutter or restricted motion | 2 | 0 | 1 | 1 | 0 | 0 | 0 | 0 |
| PEOPLE (ACTS) : Inattention/Lack of Awareness : Use of drugs or alcohol | 0 | 0 | 0 | 0 | 0 | 0 | 0 | 0 |
Causal factors are listed in order of frequency for 2021. The top 10 causal factors assigned to Tier 1 PSE for each year are highlighted.
1.5 Fatal Incident causal factors
| Causal factor group | 2012 | 2013 | 2014 | 2015 | 2016 | 2017 | 2018 | 2019 | 2020 | 2021 |
|---|---|---|---|---|---|---|---|---|---|---|
| PEOPLE (ACTS) | 8 | 12 | 2 | 5 | 1 | 1 | 0 | 8 | 4 | 4 |
| PROCESS (CONDITIONS) | 21 | 6 | 5 | 7 | 1 | 1 | 0 | 8 | 5 | 13 |
A full analysis of the causal factors assigned to fatal incidents in 2021 compared with the previous 10 years is shown in Appendix B.
Additional information on the fatal incidents reported by region can be found at https://data.iogp.org/Safety/FatalIncidents/. The information provided includes a narrative description of the incident, the corrective actions and recommendations, and the causal factors assigned by the reporting company.
1.6 High potential event causal factors
| Causal factor group | 2012 | 2013 | 2014 | 2015 | 2016 | 2017 | 2018 | 2019 | 2020 | 2021 |
|---|---|---|---|---|---|---|---|---|---|---|
| PEOPLE (ACTS) | 4 | 21 | 3 | 9 | 15 | 9 | 7 | 9 | 5 | 3 |
| PROCESS (CONDITIONS) | 12 | 45 | 25 | 33 | 33 | 33 | 24 | 20 | 24 | 7 |
The causal factors assigned to high potential events in 2021 compared with the previous 10 years are shown in Appendix B.
Additional information on the high potential events reported by region can be found on the IOGP Data website at https://data.iogp.org/Safety/HighPotentialEvents/ . The information provided includes a narrative description of the event, the corrective actions and recommendations and the causal factors assigned by the reporting company.
1.7 Barriers
The allocation of ‘barriers’ to Tier 1 process safety events was requested for the first time as part of the 2014 data submission.
| Barriers assigned to Tier 1 PSE | 2014 | 2015 | 2016 | 2017 | 2018 | 2019 | 2020 | 2021 |
|---|---|---|---|---|---|---|---|---|
| TIER 1 PSE: Hardware Barrier Failures | 135 | 156 | 170 | 125 | 143 | 163 | 192 | 153 |
| TIER 1 PSE: Human Barrier Failures | 74 | 75 | 85 | 57 | 71 | 95 | 93 | 50 |
| TIER 1 PSE: Management System Element Barrier Failure | 213 | 180 | 188 | 136 | 142 | 140 | 216 | 113 |
The barriers assigned to Tier 1 PSE are shown below. The highlighted content indicates the top 10 barriers assigned to Tier 1 PSE in 2021 compared with the previous 7 years.
| Barrier | 2014 | 2015 | 2016 | 2017 | 2018 | 2019 | 2020 | 2021 |
|---|---|---|---|---|---|---|---|---|
| Hardware Barrier Failures: Process Containment | 74 | 86 | 102 | 56 | 72 | 82 | 101 | 72 |
| Hardware Barrier Failures: Structural Integrity | 34 | 38 | 35 | 31 | 28 | 52 | 61 | 45 |
| Management System Element Barrier Failure: Asset design and integrity | 61 | 64 | 49 | 23 | 44 | 50 | 83 | 39 |
| Human Barrier Failures: Operating in accordance with procedures - PTW, Isolation of equipment, Overrides and inhibits of safety systems, Shift handover, etc. | 37 | 37 | 39 | 17 | 35 | 43 | 45 | 28 |
| Management System Element Barrier Failure: Plans and procedures | 39 | 35 | 24 | 22 | 24 | 25 | 29 | 24 |
| Management System Element Barrier Failure: Risk assessment and control | 42 | 17 | 39 | 32 | 29 | 27 | 49 | 20 |
| Management System Element Barrier Failure: Execution of activities | 29 | 13 | 22 | 19 | 16 | 10 | 28 | 17 |
| Human Barrier Failures: Surveillance, operator rounds and routine inspection | 20 | 26 | 22 | 26 | 25 | 28 | 21 | 12 |
| Hardware Barrier Failures: Ignition Control | 0 | 4 | 3 | 6 | 11 | 4 | 11 | 11 |
| Hardware Barrier Failures: Detection Systems | 12 | 12 | 11 | 15 | 7 | 13 | 8 | 10 |
| Hardware Barrier Failures: Shutdown Systems - including operational well isolation and drilling well control equipment | 9 | 6 | 9 | 7 | 14 | 9 | 5 | 8 |
| Management System Element Barrier Failure: Monitoring, reporting and learning | 11 | 16 | 12 | 20 | 12 | 6 | 12 | 5 |
| Hardware Barrier Failures: Protection Systems - including deluge and fire water systems | 4 | 4 | 5 | 7 | 9 | 2 | 4 | 5 |
| Human Barrier Failures: Acceptance of handover or restart of facilities or equipment | 10 | 5 | 8 | 4 | 4 | 11 | 11 | 3 |
| Management System Element Barrier Failure: Organization, resources and capability | 7 | 9 | 13 | 11 | 7 | 8 | 9 | 3 |
| Human Barrier Failures: Response to process alarm and upset conditions (e.g. outside safe envelope) | 7 | 5 | 8 | 6 | 6 | 8 | 5 | 3 |
| Human Barrier Failures: Response to emergencies | 0 | 1 | 7 | 3 | 0 | 5 | 7 | 2 |
| Human Barrier Failures: Authorization of temporary and mobile equipment | 0 | 1 | 1 | 1 | 1 | 0 | 4 | 2 |
| Hardware Barrier Failures: Emergency Response Equipment and Systems | 2 | 5 | 5 | 3 | 1 | 1 | 2 | 2 |
| Management System Element Barrier Failure: Assurance, review and improvement | 4 | 3 | 6 | 1 | 0 | 0 | 1 | 2 |
| Management System Element Barrier Failure: Policies, standards and objectives | 10 | 21 | 22 | 8 | 7 | 8 | 4 | 1 |
| Management System Element Barrier Failure: Commitment and accountability | 8 | 2 | 0 | 0 | 2 | 6 | 1 | 1 |
| Management System Element Barrier Failure: Stakeholders and customers | 2 | 0 | 1 | 0 | 1 | 0 | 0 | 1 |
| Hardware Barrier Failures: Life-Saving Equipment - including evacuation systems | 0 | 1 | 0 | 0 | 1 | 0 | 0 | 0 |
| Unspecified: Unspecified | 0 | 0 | 0 |
Barriers are listed in order of frequency for 2021. The top 10 barriers assigned to Tier 1 PSE for each year are highlighted.
2. Results by function
Tier 1 and Tier 2 data presented represent both onshore and offshore combined.
2.1 Drilling
2.2 Production
3. Results by activity
The Tier 1 and Tier 2 data presented in this section represent production operations both onshore and offshore and are broken down by activity, i.e., whether the event occurred during normal operations, start-up or shutdown. Drilling results are not split by activity, since this would not be meaningful.
‘Other’ is the category used when the event could not be classified under any of the other headings (start-up, normal operations or shutdown).
‘Unspecified’ is used for PSE where the activity has not been provided.
3.1 Tier 1
In 2021, 21 of the companies that reported more than one production PSE provided a breakdown by activity for Tier 1 PSE.
3.2 Tier 2
In 2021, 30 of the companies that reported more than one production PSE provided a breakdown by activity for Tier 2 PSE.
4. Results by consequence
The Tier 1 and Tier 2 data presented represent both onshore and offshore, and production and drilling, combined.
More than one consequence can be associated with each reported process safety event. The consequence classifications, extracts from Report 456 - Process safety – recommended practice on key performance indicators are listed in Table 10. Refer to Report 456 Part E for further information and threshold tables. Report 456 Part F contains examples that can be used as an aid to the interpretation of the guidance.
The analysis in this Section shows the consequences assigned to Tier 1 and Tier 2 process safety events. A single PSE can result in multiple consequences, so the total number of consequences reported will equal or exceed the total number of PSEs.
4.1 Tier 1
Information was provided on the consequences of individual events for 99% of Tier 1 PSE reported in 2021.
4.2 Tier 2
Information was provided on the consequences of individual events for 99% of Tier 2 PSE reported in 2021.
4.3 Injury as consequence
No fatal incidents were reported in 2021.
It should be noted that participation in the IOGP annual collection of safety and process safety performance data is voluntary, and not all Member Companies participate in each specific data set. In addition to the process safety event (PSE) data presented here, a further 3 Tier 1 PSE with fatal outcomes were reported as part of the safety performance data set (IOGP Reports 2024s and 2024sf). Narrative descriptions for these additional Tier 1 fatal PSE have been included in IOGP Report 2024pfh for the purposes of learning. They are not included in the data analysis or performance metrics within this report, as the reporting companies did not participate in the specific PSE data collection, but actual numbers are shown in Figures 26 and 27. Events in 2024 include:
- 1 Tier 1 PSE in Gabon resulting in 6 fatalities
- 2 Tier 1 PSE in Mexico, one resulting in 1 fatality and one resulting in 3 fatalities
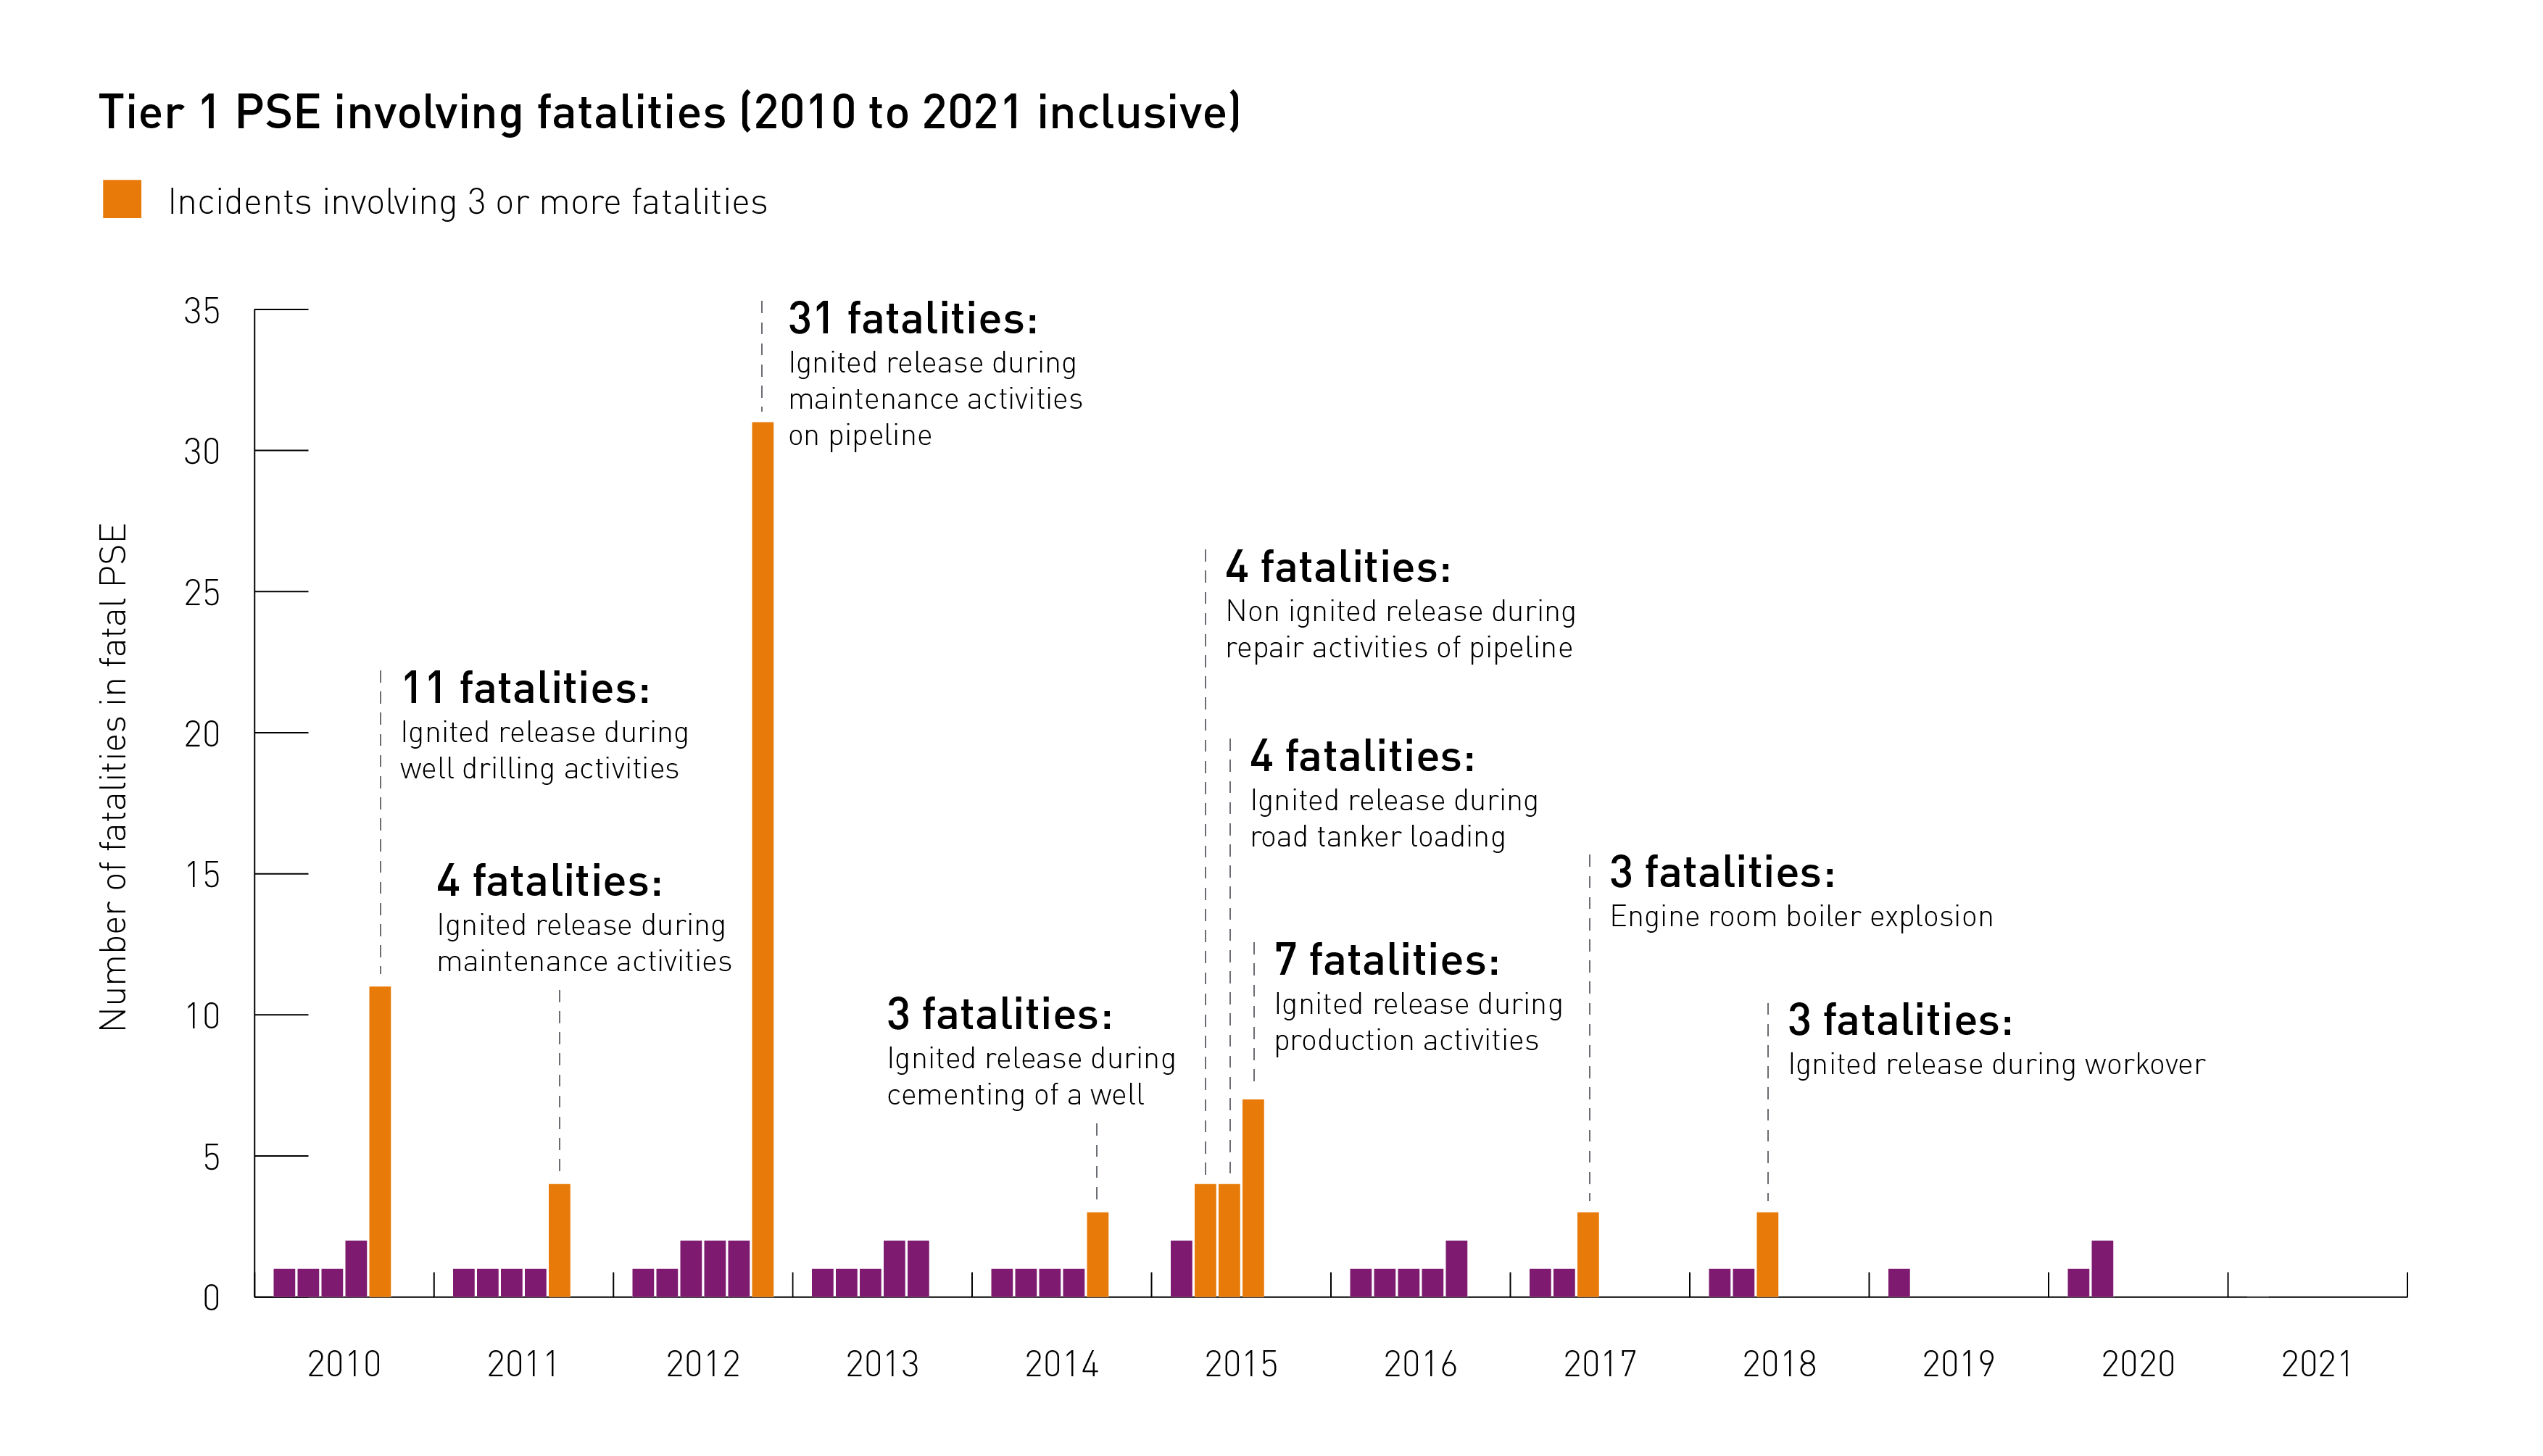
Figure 27 shows the number of fatalities in each fatal Tier 1 PSE reported. Each column represents one fatal PSE.
Tier 1 injury:
- Injury to employee or contractor: fatality and/or Lost Workday Case (‘days away from work’ or ‘lost time injury’)
- Injury to third party: fatality, or injury/illness that results in a hospital admission
4.4 Fire or explosion as consequence
Note: The Tier 1 threshold for direct cost changed with 2017 data reporting; for 2011 – 2016 data the threshold was $25,000 of direct cost to the Company. The threshold for Tier 2 is unchanged.
Tier 1 fire:
A fire or explosion resulting in greater than or equal to $100,000 of direct cost to the Company.
Tier 2 fire:
Tier 2 fire: A fire or explosion resulting in greater than or equal to $2,500 of direct cost to the Company.
Note: The Tier 1 threshold for direct cost changed with 2017 data reporting; for 2011 – 2016 data the threshold was $25,000 of direct cost to the Company. The threshold for Tier 2 was unchanged.
See Report 456.
5. Results by material released
The Tier 1 and Tier 2 data presented represent both onshore and offshore, and production and drilling, combined.
‘Unspecified’ is used for PSE where the type of material released has not been provided.
5.2 Tier 2
In 2021, 29 of the companies that reported one or more Tier 2 PSE provided information on the material released. Information on the material released was provided for 93% of Tier 2 PSE reported in 2021.
6. Results by Process Safety Fundamental
The IOGP Process Safety Fundamentals (PSFs) have been developed to support companies as they seek to reduce, and ultimately eliminate, fatal and high severity process safety events.
Designed to support those working in front-line operations, maintenance, and on wells teams, the IOGP Process Safety Fundamentals are informed by data and designed to draw attention to situations that are most likely to lead to process safety event fatalities. They are therefore not intended to exhaustively address all process safety risks and hazards in the oil and gas industry, but to be deployed in addition to a company’s underlying systems for process safety management.
For more information see IOGP Report 638, Process Safety Fundamentals.
6.1 Tier 1
Allocation of PSF to Tier 1 process safety events was introduced as part of the 2021 data request. During the IOGP validation process, a number of these were reassigned for consistency. The reported PSF represents the primary PSF associated with the PSE since more than one may have applied.
In 2021, 65% of the reported Tier 1 PSE were assigned a Process Safety Fundamental.
Note that PSE associated with mechanical integrity are not typically assigned a Process Safety Fundamental.
7. Results by region
All data submissions are reported by country and are summarized by region. The Tier 1 and Tier 2 data presented represent both onshore and offshore, and production and overall, combined.
Figure 32: The seven geographic regions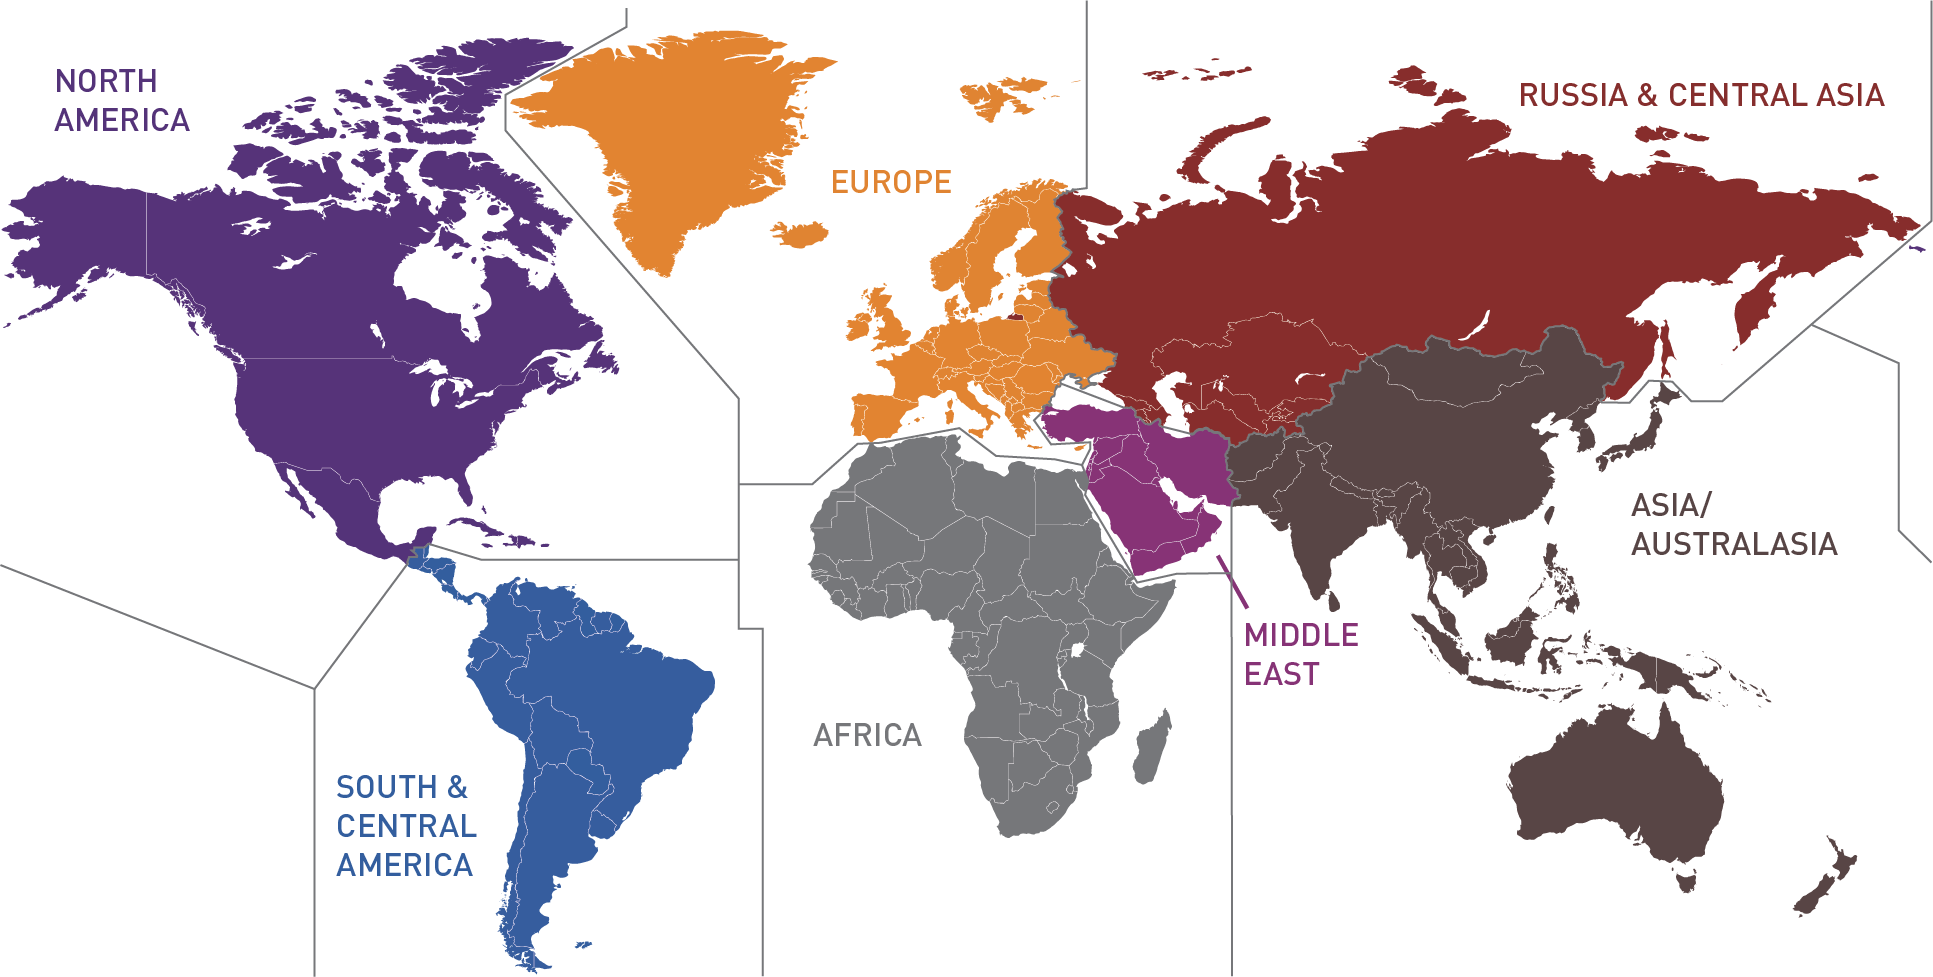
The normalized data presented only include PSE where drilling or production work hours were reported for the data set in the main safety database, hence some PSE have been excluded. See Tables B.31 – B.40 (Number of PSE used in normalized analysis – by region and function).
7.1 Drilling
See Tables B.31 – B.40 (Number of PSE used in normalized analysis – by region and function).
7.2 Production
See Tables B.31 – B.40 (Number of PSE used in normalized analysis – by region and function).
8. Company results
Tier 1 and Tier 2 PSE rates are shown by company in rank order of Tier 1 PSE performance. Company names have been replaced with a 2-letter code. A new code is assigned every year.
Data are excluded from PSE rate calculations where either drilling or production work hours are not reported for the data set.
‘Overall’ refers to the rate for all companies.
Appendix A - Database dimensions
The PSE data collected by IOGP are based on the numbers of Tier 1 and Tier 2 PSE reported by companies, separately for drilling and production activities, and subdivided into offshore and onshore data.
PSE relating to sabotage or wilful damage are excluded from the results presented in Sections 1–7, but are reported separately in Section 1.2.
The entire IOGP safety performance database, which is used to produce the annual Safety performance indicators report (IOGP Report 2021s), contains work hours which are split into offshore and onshore work hours and five work function categories (defined in the glossary of terms in IOGP Report 2021s - Safety performance indicators - 2021 data as work functions):
- exploration
- drilling
- production
- construction
- unspecified
For the purposes of the process safety event database, the only applicable functional categories from the entire IOGP safety performance database are drilling and production, onshore and offshore. The work hours associated with PSEs reported in 2012-2021 for drilling and production, onshore and offshore, are shown in Table A.1, below.
| Number of companies reporting PSE | Data sets where PSE data reported | Related work hours (millions) | |||||
|---|---|---|---|---|---|---|---|
| Year | Overall | Tier 1 | Tier 2 | Tier 1 | Tier 2 | Tier 1 | Tier 2 |
| 2011 | 26 | 26 | 20 | 322 | 270 | 971 | 913 |
| 2012 | 32 | 32 | 29 | 428 | 426 | 1,197 | 1,160 |
| 2013 | 39 | 39 | 38 | 378 | 375 | 1,326 | 1,311 |
| 2014 | 44 | 44 | 42 | 571 | 547 | 1,639 | 1,631 |
| 2015 | 44 | 44 | 44 | 589 | 586 | 1,522 | 1,588 |
| 2016 | 39 | 39 | 39 | 487 | 481 | 1,096 | 1,015 |
| 2017 | 43 | 43 | 43 | 507 | 513 | 1,450 | 1,443 |
| 2018 | 42 | 42 | 41 | 548 | 533 | 1,495 | 1,440 |
| 2019 | 47 | 47 | 47 | 508 | 507 | 1,712 | 1,724 |
| 2020 | 44 | 44 | 43 | 346 | 346 | 1,406 | 1,406 |
| 2021 | 47 | 47 | 47 | 363 | 363 | 1,604 | 1,604 |
| 2022 | 47 | 47 | 47 | 365 | 365 | 1,509 | 1,509 |
| 2023 | 52 | 52 | 52 | 355 | 355 | 1,939 | 1,939 |
| 2024 | 48 | 48 | 48 | 321 | 322 | 2,234 | 2,234 |
| ONSHORE | Work hours in PSE reporting database (‘000s) | ||
|---|---|---|---|
| Year | Drilling | Production | Total |
| 2015 | 308,974 | 764,793 | 1,073,767 |
| 2016 | 176,569 | 538,959 | 715,528 |
| 2017 | 213,760 | 753,564 | 967,324 |
| 2018 | 197,136 | 839,533 | 1,036,669 |
| 2019 | 239,913 | 926,493 | 1,166,406 |
| 2020 | 179,284 | 746,991 | 926,275 |
| 2021 | 195,393 | 880,279 | 1,075,672 |
| 2022 | 152,980 | 772,140 | 925,120 |
| 2023 | 292,694 | 957,336 | 1,250,030 |
| 2024 | 375,812 | 1,154,223 | 1,530,035 |
| OFFSHORE | Work hours in PSE reporting database (‘000s) | ||
|---|---|---|---|
| Year | Drilling | Production | Total |
| 2015 | 194,746 | 402,807 | 597,553 |
| 2016 | 127,434 | 253,391 | 380,825 |
| 2017 | 127,431 | 354,782 | 482,213 |
| 2018 | 120,748 | 337,548 | 458,296 |
| 2019 | 150,527 | 410,892 | 561,419 |
| 2020 | 127,912 | 352,271 | 480,183 |
| 2021 | 130,567 | 397,290 | 527,857 |
| 2022 | 141,909 | 442,247 | 584,156 |
| 2023 | 194,382 | 494,415 | 688,797 |
| 2024 | 226,679 | 477,432 | 704,111 |
| OVERALL | Work hours in PSE reporting database (‘000s) | ||
|---|---|---|---|
| Year | Drilling | Production | Total |
| 2015 | 503,720 | 1,167,600 | 1,671,320 |
| 2016 | 304,003 | 792,350 | 1,096,353 |
| 2017 | 341,191 | 1,108,346 | 1,449,537 |
| 2018 | 317,884 | 1,177,081 | 1,494,965 |
| 2019 | 390,440 | 1,337,385 | 1,727,825 |
| 2020 | 307,196 | 1,099,262 | 1,406,458 |
| 2021 | 325,960 | 1,277,569 | 1,603,529 |
| 2022 | 294,889 | 1,214,387 | 1,509,276 |
| 2023 | 487,076 | 1,451,751 | 1,938,827 |
| 2024 | 602,491 | 1,631,655 | 2,234,146 |
The work hours associated with the PSE data reported have been calculated as a subset of the drilling and production function work hours from the safety performance database (see IOGP Report 2021s - Safety performance indicators – 2021 data) which have been reported for 2012-2021. Work hours have been used as a reference to provide an indication of scope for the PSE data presented throughout this Report.
Work hours have been included where the company has reported associated Tier 1 or Tier 2 PSE (PSE values of zero or greater), for the country and onshore/offshore location (data set). Work hours are excluded for data sets where Tier 1 or Tier 2 PSE figures are not available. The associated work hours differ between Tier 1 and Tier 2 because, although all companies reported both Tier 1 and Tier 2 PSE data, not all companies reported PSE data for all of their global operations.
Some companies that reported PSE data do not split work hours by work function. The reported PSEs and work hours associated with these companies have therefore been excluded from the normalized analysis. Table A.3 shows the number of data sets reported that include Tier 1 or Tier 2 data as well as related drilling or production work hours.
| Tier 1 PSE data sets | Tier 2 PSE data sets | ||||||||
|---|---|---|---|---|---|---|---|---|---|
| Year | Total PSE data sets | Tier 1 Total | By activity | By material | By consequence | Tier 2 Total | By activity | By material | By consequence |
| 2015 | 594 | 589 | 57 | 58 | 62 | 586 | 113 | 113 | 117 |
| 2016 | 491 | 487 | 52 | 51 | 61 | 481 | 88 | 88 | 91 |
| 2017 | 517 | 507 | 63 | 63 | 70 | 513 | 100 | 99 | 103 |
| 2018 | 548 | 548 | 50 | 51 | 59 | 533 | 87 | 87 | 87 |
| 2019 | 510 | 508 | 50 | 55 | 63 | 507 | 88 | 90 | 107 |
| 2020 | 347 | 346 | 54 | 48 | 55 | 346 | 100 | 96 | 101 |
| 2021 | 363 | 363 | 53 | 46 | 53 | 363 | 91 | 86 | 91 |
| 2022 | 365 | 365 | 47 | 45 | 47 | 365 | 72 | 70 | 72 |
| 2023 | 355 | 355 | 53 | 51 | 53 | 355 | 77 | 76 | 77 |
| 2024 | 322 | 321 | 46 | 47 | 45 | 322 | 84 | 84 | 82 |
Excludes data sets where related drilling or production work hours were not reported.
Appendix B - Data tables
The following data are presented in relation to the sections where they were used.
Section 1 Overall results
| Year | Location | Work hours (thousands) | Number of Tier 1 PSE for normalized results* | Number of Tier 1 PSE | Tier 1 PSE rate | Employee / Contractor fatalities (number of deaths) | 3rd party fatalities (number of deaths) | Fatality or LWDC as consequence (number of PSE) | 3rd party hospitalization or fatality as consequence (number of Tier 1 PSE) |
|---|---|---|---|---|---|---|---|---|---|
| 2015 | Onshore | 959,741 | 183 | 220 | 0.19 | 10 | 0 | 17 | 0 |
| 2015 | Offshore | 562,681 | 33 | 34 | 0.06 | 7 | 0 | 6 | 0 |
| 2015 | OVERALL | 1,522,422 | 216 | 254 | 0.14 | 17 | 0 | 23 | 0 |
| 2016 | Onshore | 715,528 | 140 | 155 | 0.20 | 6 | 0 | 16 | 1 |
| 2016 | Offshore | 380,825 | 36 | 37 | 0.09 | 0 | 0 | 1 | 0 |
| 2016 | OVERALL | 1,096,353 | 176 | 192 | 0.16 | 6 | 0 | 17 | 1 |
| 2017 | Onshore | 967,324 | 139 | 143 | 0.14 | 1 | 0 | 10 | 0 |
| 2017 | Offshore | 482,213 | 48 | 49 | 0.10 | 4 | 0 | 6 | 0 |
| 2017 | OVERALL | 1,449,537 | 187 | 192 | 0.13 | 5 | 0 | 16 | 0 |
| 2018 | Onshore | 1,036,669 | 208 | 226 | 0.20 | 4 | 0 | 9 | 0 |
| 2018 | Offshore | 458,296 | 30 | 30 | 0.07 | 0 | 1 | 0 | 1 |
| 2018 | OVERALL | 1,494,965 | 238 | 256 | 0.16 | 4 | 1 | 9 | 1 |
| 2019 | Onshore | 1,151,997 | 209 | 224 | 0.18 | 1 | 0 | 7 | 1 |
| 2019 | Offshore | 560,004 | 37 | 37 | 0.07 | 0 | 0 | 3 | 0 |
| 2019 | OVERALL | 1,712,001 | 246 | 261 | 0.14 | 1 | 0 | 10 | 1 |
| 2020 | Onshore | 926,275 | 147 | 158 | 0.16 | 3 | 0 | 9 | 3 |
| 2020 | Offshore | 480,183 | 26 | 26 | 0.05 | 0 | 0 | 2 | 0 |
| 2020 | OVERALL | 1,406,458 | 173 | 184 | 0.12 | 3 | 0 | 11 | 3 |
| 2021 | Onshore | 1,075,672 | 172 | 172 | 0.16 | 0 | 0 | 10 | 1 |
| 2021 | Offshore | 527,857 | 21 | 21 | 0.04 | 0 | 0 | 3 | 0 |
| 2021 | OVERALL | 1,603,529 | 193 | 193 | 0.12 | 0 | 0 | 13 | 1 |
| 2022 | Onshore | 925,120 | 142 | 148 | 0.15 | 3 | 0 | 11 | 0 |
| 2022 | Offshore | 584,156 | 34 | 34 | 0.06 | 1 | 0 | 5 | 0 |
| 2022 | OVERALL | 1,509,276 | 176 | 182 | 0.12 | 4 | 0 | 16 | 0 |
| 2023 | Onshore | 1,250,030 | 170 | 171 | 0.14 | 5 | 0 | 18 | 0 |
| 2023 | Offshore | 688,797 | 47 | 47 | 0.07 | 0 | 0 | 9 | 0 |
| 2023 | OVERALL | 1,938,827 | 217 | 218 | 0.11 | 5 | 0 | 27 | 0 |
| 2024 | Onshore | 1,530,035 | 154 | 157 | 0.10 | 0 | 0 | 9 | 0 |
| 2024 | Offshore | 704,111 | 31 | 31 | 0.04 | 3 | 0 | 6 | 0 |
| 2024 | OVERALL | 2,234,146 | 185 | 188 | 0.08 | 3 | 0 | 15 | 0 |
| Year | Onshore / offshore | Work hours (thousands) | Number of Tier 2 PSE for normalized results* | Number of Tier 2 PSE | Tier 2 PSE rate | Recordable injury as consequence fatalities (number Tier 2 PSE) |
|---|---|---|---|---|---|---|
| 2015 | Onshore | 1,057,082 | 540 | 630 | 0.51 | 12 |
| 2015 | Offshore | 530,627 | 160 | 165 | 0.30 | 2 |
| 2015 | OVERALL | 1,587,709 | 700 | 795 | 0.44 | 14 |
| 2016 | Onshore | 698,509 | 327 | 440 | 0.47 | 7 |
| 2016 | Offshore | 316,095 | 117 | 275 | 0.37 | 1 |
| 2016 | OVERALL | 1,014,604 | 444 | 715 | 0.44 | 8 |
| 2017 | Onshore | 963,467 | 376 | 434 | 0.39 | 4 |
| 2017 | Offshore | 479,994 | 182 | 183 | 0.38 | 2 |
| 2017 | OVERALL | 1,443,461 | 558 | 617 | 0.39 | 6 |
| 2018 | Onshore | 991,925 | 401 | 446 | 0.40 | 7 |
| 2018 | Offshore | 447,719 | 154 | 161 | 0.34 | 2 |
| 2018 | OVERALL | 1,439,644 | 555 | 607 | 0.39 | 9 |
| 2019 | Onshore | 1,165,376 | 601 | 664 | 0.52 | 4 |
| 2019 | Offshore | 558,639 | 128 | 131 | 0.23 | 4 |
| 2019 | OVERALL | 1,724,015 | 729 | 795 | 0.42 | 8 |
| 2020 | Onshore | 926,275 | 370 | 416 | 0.40 | 1 |
| 2020 | Offshore | 480,183 | 116 | 120 | 0.24 | 1 |
| 2020 | OVERALL | 1,406,458 | 486 | 536 | 0.35 | 2 |
| 2021 | Onshore | 1,075,672 | 521 | 529 | 0.48 | 7 |
| 2021 | Offshore | 527,857 | 93 | 93 | 0.18 | 4 |
| 2021 | OVERALL | 1,603,529 | 614 | 622 | 0.38 | 11 |
| 2022 | Onshore | 925,120 | 478 | 485 | 0.52 | 7 |
| 2022 | Offshore | 584,156 | 78 | 78 | 0.13 | 6 |
| 2022 | OVERALL | 1,509,276 | 556 | 563 | 0.37 | 13 |
| 2023 | Onshore | 1,250,030 | 517 | 530 | 0.41 | 7 |
| 2023 | Offshore | 688,797 | 90 | 90 | 0.13 | 1 |
| 2023 | OVERALL | 1,938,827 | 607 | 620 | 0.31 | 8 |
| 2024 | Onshore | 1,530,035 | 523 | 610 | 0.34 | 5 |
| 2024 | Offshore | 704,111 | 115 | 115 | 0.16 | 2 |
| 2024 | OVERALL | 2,234,146 | 638 | 725 | 0.29 | 7 |
| Year | Onshore/offshore | Number of PSE | Number of PSE for normalized results* | PSE rate (PSE per million work hours)* | |||
|---|---|---|---|---|---|---|---|
| Tier 1 | Tier 2 | Tier 1 | Tier 2 | Tier 1 | Tier 2 | ||
| 2015 | Onshore | 220 | 630 | 183 | 540 | 0.19 | 0.51 |
| 2015 | Offshore | 34 | 165 | 33 | 160 | 0.06 | 0.30 |
| 2016 | Onshore | 155 | 440 | 140 | 327 | 0.20 | 0.47 |
| 2016 | Offshore | 37 | 275 | 36 | 117 | 0.09 | 0.37 |
| 2017 | Onshore | 143 | 434 | 139 | 376 | 0.14 | 0.39 |
| 2017 | Offshore | 49 | 183 | 48 | 182 | 0.10 | 0.38 |
| 2018 | Onshore | 226 | 446 | 208 | 401 | 0.20 | 0.40 |
| 2018 | Offshore | 30 | 161 | 30 | 154 | 0.07 | 0.34 |
| 2019 | Onshore | 224 | 664 | 209 | 601 | 0.18 | 0.52 |
| 2019 | Offshore | 37 | 131 | 37 | 128 | 0.07 | 0.23 |
| 2020 | Onshore | 158 | 416 | 147 | 370 | 0.16 | 0.40 |
| 2020 | Offshore | 26 | 120 | 26 | 116 | 0.05 | 0.24 |
| 2021 | Onshore | 172 | 529 | 172 | 521 | 0.16 | 0.48 |
| 2021 | Offshore | 21 | 93 | 21 | 93 | 0.04 | 0.18 |
| 2022 | Onshore | 148 | 485 | 142 | 478 | 0.15 | 0.52 |
| 2022 | Offshore | 34 | 78 | 34 | 78 | 0.06 | 0.13 |
| 2023 | Onshore | 171 | 530 | 170 | 517 | 0.14 | 0.41 |
| 2023 | Offshore | 47 | 90 | 47 | 90 | 0.07 | 0.13 |
| 2024 | Onshore | 157 | 610 | 154 | 523 | 0.10 | 0.34 |
| 2024 | Offshore | 31 | 115 | 31 | 115 | 0.04 | 0.16 |
For related work hours for normalized results, see Table B.4 (Scope – onshore and offshore).
| Year | Onshore/offshore | Number of companies reporting PSE | Number of data sets where PSE data reported | Related work hours (millions)* | Work hours for PSE data as percentage of total IOGP safety* | ||||
|---|---|---|---|---|---|---|---|---|---|
| Tier 1 | Tier 2 | Tier 1 | Tier 2 | Tier 1 | Tier 2 | Tier 1 | Tier 2 | ||
| 2015 | Onshore | 43 | 44 | 431 | 430 | 960 | 1,057 | 80 | 88 |
| 2015 | Offshore | 42 | 41 | 158 | 156 | 563 | 531 | 85 | 80 |
| 2016 | Onshore | 39 | 39 | 360 | 353 | 716 | 699 | 81 | 79 |
| 2016 | Offshore | 37 | 38 | 127 | 128 | 381 | 316 | 67 | 56 |
| 2017 | Onshore | 43 | 43 | 350 | 357 | 967 | 963 | 92 | 92 |
| 2017 | Offshore | 41 | 40 | 157 | 156 | 482 | 480 | 86 | 86 |
| 2018 | Onshore | 42 | 41 | 374 | 365 | 1,037 | 992 | 92 | 88 |
| 2018 | Offshore | 41 | 38 | 174 | 168 | 458 | 448 | 86 | 84 |
| 2019 | Onshore | 47 | 47 | 359 | 358 | 1,152 | 1,165 | 98 | 99 |
| 2019 | Offshore | 44 | 44 | 149 | 149 | 560 | 559 | 99 | 99 |
| 2020 | Onshore | 40 | 39 | 217 | 216 | 926 | 926 | 98 | 98 |
| 2020 | Offshore | 34 | 34 | 129 | 130 | 480 | 480 | 100 | 100 |
| 2021 | Onshore | 44 | 44 | 227 | 227 | 1,076 | 1,076 | 96 | 96 |
| 2021 | Offshore | 36 | 36 | 136 | 136 | 528 | 528 | 100 | 100 |
| 2022 | Onshore | 45 | 45 | 220 | 220 | 925 | 925 | 93 | 93 |
| 2022 | Offshore | 39 | 39 | 145 | 145 | 584 | 584 | 98 | 98 |
| 2023 | Onshore | 49 | 49 | 218 | 218 | 1,250 | 1,250 | 96 | 96 |
| 2023 | Offshore | 41 | 41 | 137 | 137 | 689 | 689 | 100 | 100 |
| 2024 | Onshore | 44 | 44 | 199 | 200 | 1,530 | 1,530 | 91 | 91 |
| 2024 | Offshore | 37 | 37 | 122 | 122 | 704 | 704 | 79 | 79 |
Note: Not all of the companies that submitted drilling and production work hours within the IOGP safety performance database submitted process safety event data. A number less than 100% in the table above indicates that process safety events are not reported for all drilling and production work hours in the entire safety database.
PSE Data Set: A set of data with distinct company, country and location (onshore/offshore) where PSE data have been entered (i.e., not blank).
| Causal factors assigned to Tier 1 PSE – onshore | 2014 | 2015 | 2016 | 2017 | 2018 | 2019 | 2020 | 2021 |
|---|---|---|---|---|---|---|---|---|
| PROCESS (CONDITIONS) : Tools, Equipment, Materials and Products : Inadequate maintenance/inspection/testing | 41 | 52 | 46 | 58 | 41 | 42 | 41 | 40 |
| PROCESS (CONDITIONS) : Tools, Equipment, Materials and Products : Inadequate design/specification/management of change | 29 | 30 | 49 | 21 | 24 | 37 | 42 | 25 |
| PROCESS (CONDITIONS) : Tools, Equipment, Materials and Products : Inadequate/defective tools/equipment/materials/products | 23 | 42 | 33 | 20 | 56 | 32 | 34 | 20 |
| PROCESS (CONDITIONS) : Organizational : Inadequate hazard identification or risk assessment | 28 | 19 | 31 | 18 | 22 | 15 | 29 | 18 |
| PROCESS (CONDITIONS) : Organizational : Inadequate work standards/procedures | 17 | 23 | 31 | 18 | 21 | 19 | 26 | 15 |
| PEOPLE (ACTS) : Following Procedures : Deviation unintentional (by individual or group) | 12 | 4 | 23 | 9 | 12 | 13 | 15 | 9 |
| PROCESS (CONDITIONS) : Work Place Hazards : Storms or acts of nature | 1 | 9 | 11 | 3 | 16 | 11 | 4 | 9 |
| PROCESS (CONDITIONS) : Organizational : Inadequate training/competence | 11 | 10 | 12 | 10 | 11 | 8 | 10 | 8 |
| PROCESS (CONDITIONS) : Organizational : Inadequate communication | 7 | 9 | 13 | 6 | 7 | 5 | 18 | 7 |
| PROCESS (CONDITIONS) : Organizational : Inadequate supervision | 10 | 8 | 13 | 7 | 10 | 8 | 6 | 7 |
| PROCESS (CONDITIONS) : Protective Systems : Inadequate/defective guards or protective barriers | 8 | 15 | 8 | 10 | 8 | 14 | 10 | 5 |
| PEOPLE (ACTS) : Inattention/Lack of Awareness : Lack of attention/distracted by other concerns/stress | 4 | 6 | 5 | 5 | 1 | 8 | 9 | 5 |
| PEOPLE (ACTS) : Inattention/Lack of Awareness : Improper decision making or lack of judgment | 6 | 11 | 11 | 8 | 9 | 8 | 12 | 4 |
| PROCESS (CONDITIONS) : Protective Systems : Inadequate/defective warning systems/safety devices | 5 | 6 | 10 | 14 | 11 | 15 | 10 | 4 |
| PEOPLE (ACTS) : Use of Protective Methods : Failure to warn of hazard | 2 | 3 | 7 | 7 | 2 | 4 | 9 | 4 |
| PEOPLE (ACTS) : Use of Tools, Equipment, Materials and Products : Improper use/position of tools/equipment/materials/products | 5 | 4 | 4 | 3 | 3 | 5 | 10 | 3 |
| PEOPLE (ACTS) : Use of Protective Methods : Inadequate use of safety systems | 2 | 3 | 5 | 1 | 4 | 1 | 2 | 3 |
| PROCESS (CONDITIONS) : Protective Systems : Inadequate security provisions or systems | 0 | 1 | 0 | 0 | 0 | 0 | 2 | 3 |
| PEOPLE (ACTS) : Following Procedures : Deviation intentional (by individual or group) | 1 | 2 | 3 | 0 | 3 | 3 | 1 | 3 |
| PROCESS (CONDITIONS) : Protective Systems : Inadequate/defective Personal Protective Equipment | 0 | 1 | 3 | 0 | 3 | 0 | 1 | 3 |
| PEOPLE (ACTS) : Following Procedures : Improper position (in the line of fire) | 1 | 5 | 0 | 3 | 4 | 3 | 4 | 2 |
| PEOPLE (ACTS) : Use of Protective Methods : Equipment or materials not secured | 2 | 3 | 4 | 1 | 2 | 3 | 4 | 2 |
| PROCESS (CONDITIONS) : Work Place Hazards : Hazardous atmosphere (explosive/toxic/asphyxiant) | 3 | 4 | 4 | 7 | 3 | 3 | 3 | 2 |
| PEOPLE (ACTS) : Use of Protective Methods : Personal Protective Equipment not used or used improperly | 1 | 1 | 1 | 1 | 2 | 0 | 1 | 2 |
| PEOPLE (ACTS) : Use of Tools, Equipment, Materials and Products : Servicing of energized equipment/inadequate energy isolation | 1 | 3 | 4 | 2 | 0 | 4 | 6 | 1 |
| PEOPLE (ACTS) : Following Procedures : Improper lifting or loading | 0 | 0 | 2 | 0 | 2 | 1 | 4 | 1 |
| PROCESS (CONDITIONS) : Organizational : Poor leadership/organizational culture | 3 | 4 | 1 | 0 | 1 | 0 | 3 | 1 |
| PEOPLE (ACTS) : Following Procedures : Work or motion at improper speed | 0 | 0 | 0 | 0 | 0 | 0 | 1 | 1 |
| PEOPLE (ACTS) : Use of Protective Methods : Disabled or removed guards, warning systems or safety devices | 2 | 3 | 2 | 3 | 1 | 0 | 0 | 1 |
| PEOPLE (ACTS) : Inattention/Lack of Awareness : Acts of violence | 0 | 0 | 0 | 0 | 0 | 0 | 4 | 0 |
| PROCESS (CONDITIONS) : Organizational : Failure to report/learn from events | 2 | 6 | 4 | 1 | 2 | 1 | 2 | 0 |
| PEOPLE (ACTS) : Following Procedures : Overexertion or improper position/posture for task | 0 | 0 | 0 | 0 | 0 | 1 | 1 | 0 |
| PROCESS (CONDITIONS) : Work Place Hazards : Inadequate surfaces, floors, walkways or roads | 1 | 2 | 2 | 1 | 1 | 0 | 1 | 0 |
| PROCESS (CONDITIONS) : Work Place Hazards : Congestion, clutter or restricted motion | 2 | 0 | 0 | 1 | 0 | 0 | 0 | 0 |
| PEOPLE (ACTS) : Inattention/Lack of Awareness : Fatigue | 0 | 0 | 1 | 0 | 0 | 0 | 0 | 0 |
| PEOPLE (ACTS) : Inattention/Lack of Awareness : Use of drugs or alcohol | 0 | 0 | 0 | 0 | 0 | 0 | 0 | 0 |
| Causal factors assigned to Tier 1 PSE – offshore | 2014 | 2015 | 2016 | 2017 | 2018 | 2019 | 2020 | 2021 |
|---|---|---|---|---|---|---|---|---|
| PROCESS (CONDITIONS) : Tools, Equipment, Materials and Products : Inadequate maintenance/inspection/testing | 19 | 13 | 12 | 10 | 6 | 12 | 18 | 10 |
| PROCESS (CONDITIONS) : Tools, Equipment, Materials and Products : Inadequate design/specification/management of change | 13 | 12 | 14 | 6 | 10 | 13 | 12 | 8 |
| PROCESS (CONDITIONS) : Organizational : Inadequate hazard identification or risk assessment | 19 | 14 | 15 | 4 | 6 | 9 | 17 | 6 |
| PROCESS (CONDITIONS) : Organizational : Inadequate work standards/procedures | 13 | 9 | 9 | 4 | 4 | 9 | 16 | 5 |
| PROCESS (CONDITIONS) : Protective Systems : Inadequate/defective guards or protective barriers | 5 | 5 | 6 | 6 | 0 | 2 | 7 | 4 |
| PEOPLE (ACTS) : Inattention/Lack of Awareness : Improper decision making or lack of judgment | 7 | 5 | 1 | 0 | 2 | 2 | 5 | 4 |
| PEOPLE (ACTS) : Following Procedures : Deviation unintentional (by individual or group) | 11 | 4 | 10 | 2 | 3 | 13 | 3 | 3 |
| PROCESS (CONDITIONS) : Organizational : Inadequate training/competence | 10 | 5 | 11 | 3 | 4 | 2 | 10 | 2 |
| PROCESS (CONDITIONS) : Organizational : Inadequate supervision | 7 | 3 | 7 | 3 | 2 | 2 | 4 | 2 |
| PROCESS (CONDITIONS) : Protective Systems : Inadequate/defective warning systems/safety devices | 5 | 3 | 7 | 4 | 3 | 5 | 3 | 2 |
| PEOPLE (ACTS) : Use of Tools, Equipment, Materials and Products : Servicing of energized equipment/inadequate energy isolation | 1 | 1 | 2 | 0 | 1 | 2 | 3 | 2 |
| PROCESS (CONDITIONS) : Organizational : Inadequate communication | 2 | 2 | 2 | 4 | 3 | 6 | 2 | 2 |
| PEOPLE (ACTS) : Following Procedures : Deviation intentional (by individual or group) | 0 | 1 | 0 | 0 | 0 | 1 | 0 | 2 |
| PROCESS (CONDITIONS) : Tools, Equipment, Materials and Products : Inadequate/defective tools/equipment/materials/products | 16 | 6 | 11 | 4 | 7 | 5 | 15 | 1 |
| PEOPLE (ACTS) : Inattention/Lack of Awareness : Lack of attention/distracted by other concerns/stress | 3 | 4 | 2 | 1 | 4 | 5 | 1 | 1 |
| PROCESS (CONDITIONS) : Work Place Hazards : Hazardous atmosphere (explosive/toxic/asphyxiant) | 0 | 0 | 0 | 2 | 1 | 0 | 1 | 1 |
| PEOPLE (ACTS) : Use of Protective Methods : Disabled or removed guards, warning systems or safety devices | 1 | 1 | 0 | 0 | 1 | 0 | 1 | 1 |
| PEOPLE (ACTS) : Use of Tools, Equipment, Materials and Products : Improper use/position of tools/equipment/materials/products | 4 | 1 | 1 | 1 | 1 | 1 | 0 | 1 |
| PROCESS (CONDITIONS) : Organizational : Failure to report/learn from events | 2 | 4 | 0 | 2 | 2 | 3 | 8 | 0 |
| PEOPLE (ACTS) : Following Procedures : Improper position (in the line of fire) | 1 | 0 | 1 | 1 | 0 | 3 | 2 | 0 |
| PEOPLE (ACTS) : Use of Protective Methods : Failure to warn of hazard | 1 | 0 | 2 | 0 | 1 | 1 | 2 | 0 |
| PEOPLE (ACTS) : Use of Protective Methods : Equipment or materials not secured | 0 | 0 | 1 | 0 | 0 | 1 | 1 | 0 |
| PEOPLE (ACTS) : Inattention/Lack of Awareness : Fatigue | 0 | 1 | 0 | 0 | 0 | 1 | 1 | 0 |
| PROCESS (CONDITIONS) : Organizational : Poor leadership/organizational culture | 6 | 2 | 1 | 2 | 0 | 0 | 1 | 0 |
| PEOPLE (ACTS) : Following Procedures : Work or motion at improper speed | 1 | 0 | 0 | 0 | 0 | 0 | 1 | 0 |
| PEOPLE (ACTS) : Following Procedures : Overexertion or improper position/posture for task | 0 | 0 | 0 | 0 | 0 | 0 | 1 | 0 |
| PROCESS (CONDITIONS) : Protective Systems : Inadequate security provisions or systems | 0 | 0 | 2 | 1 | 0 | 2 | 0 | 0 |
| PEOPLE (ACTS) : Use of Protective Methods : Personal Protective Equipment not used or used improperly | 2 | 0 | 0 | 1 | 0 | 1 | 0 | 0 |
| PROCESS (CONDITIONS) : Protective Systems : Inadequate/defective Personal Protective Equipment | 2 | 0 | 1 | 0 | 2 | 0 | 0 | 0 |
| PEOPLE (ACTS) : Use of Protective Methods : Inadequate use of safety systems | 1 | 0 | 2 | 1 | 1 | 0 | 0 | 0 |
| PROCESS (CONDITIONS) : Work Place Hazards : Storms or acts of nature | 2 | 0 | 0 | 0 | 1 | 0 | 0 | 0 |
| PROCESS (CONDITIONS) : Work Place Hazards : Congestion, clutter or restricted motion | 0 | 0 | 1 | 0 | 0 | 0 | 0 | 0 |
| PROCESS (CONDITIONS) : Work Place Hazards : Inadequate surfaces, floors, walkways or roads | 1 | 0 | 0 | 0 | 0 | 0 | 0 | 0 |
| PEOPLE (ACTS) : Inattention/Lack of Awareness : Acts of violence | 0 | 0 | 0 | 0 | 0 | 0 | 0 | 0 |
| PEOPLE (ACTS) : Inattention/Lack of Awareness : Use of drugs or alcohol | 0 | 0 | 0 | 0 | 0 | 0 | 0 | 0 |
| PEOPLE (ACTS) : Following Procedures : Improper lifting or loading | 0 | 0 | 0 | 0 | 0 | 0 | 0 | 0 |
| Causal factors assigned to Tier 1 PSE – drilling and completion operations | 2014 | 2015 | 2016 | 2017 | 2018 | 2019 | 2020 | 2021 |
|---|---|---|---|---|---|---|---|---|
| PROCESS (CONDITIONS) : Tools, Equipment, Materials and Products : Inadequate design/specification/management of change | 2 | 5 | 3 | 0 | 0 | 4 | 3 | 2 |
| PROCESS (CONDITIONS) : Protective Systems : Inadequate/defective guards or protective barriers | 2 | 1 | 1 | 1 | 0 | 0 | 1 | 2 |
| PROCESS (CONDITIONS) : Work Place Hazards : Hazardous atmosphere (explosive/toxic/asphyxiant) | 0 | 2 | 1 | 0 | 0 | 0 | 1 | 2 |
| PROCESS (CONDITIONS) : Organizational : Inadequate work standards/procedures | 6 | 5 | 3 | 1 | 2 | 1 | 4 | 1 |
| PROCESS (CONDITIONS) : Organizational : Inadequate supervision | 1 | 2 | 0 | 0 | 1 | 0 | 1 | 1 |
| PEOPLE (ACTS) : Inattention/Lack of Awareness : Lack of attention/distracted by other concerns/stress | 1 | 2 | 0 | 0 | 0 | 2 | 0 | 1 |
| PEOPLE (ACTS) : Use of Protective Methods : Inadequate use of safety systems | 2 | 0 | 1 | 0 | 1 | 0 | 0 | 1 |
| PROCESS (CONDITIONS) : Organizational : Inadequate hazard identification or risk assessment | 3 | 6 | 6 | 2 | 1 | 2 | 5 | 0 |
| PEOPLE (ACTS) : Inattention/Lack of Awareness : Improper decision making or lack of judgment | 3 | 4 | 1 | 0 | 2 | 2 | 4 | 0 |
| PROCESS (CONDITIONS) : Organizational : Inadequate communication | 1 | 0 | 1 | 0 | 0 | 0 | 3 | 0 |
| PEOPLE (ACTS) : Use of Tools, Equipment, Materials and Products : Improper use/position of tools/equipment/materials/products | 0 | 1 | 0 | 1 | 1 | 0 | 2 | 0 |
| PROCESS (CONDITIONS) : Tools, Equipment, Materials and Products : Inadequate maintenance/inspection/testing | 2 | 2 | 4 | 1 | 0 | 4 | 1 | 0 |
| PROCESS (CONDITIONS) : Tools, Equipment, Materials and Products : Inadequate/defective tools/equipment/materials/products | 5 | 3 | 0 | 1 | 2 | 1 | 1 | 0 |
| PROCESS (CONDITIONS) : Organizational : Inadequate training/competence | 0 | 3 | 2 | 0 | 1 | 1 | 1 | 0 |
| PEOPLE (ACTS) : Use of Protective Methods : Equipment or materials not secured | 0 | 1 | 1 | 0 | 1 | 0 | 1 | 0 |
| PROCESS (CONDITIONS) : Organizational : Failure to report/learn from events | 0 | 1 | 0 | 0 | 1 | 0 | 1 | 0 |
| PEOPLE (ACTS) : Use of Tools, Equipment, Materials and Products : Servicing of energized equipment/inadequate energy isolation | 0 | 1 | 2 | 0 | 0 | 0 | 1 | 0 |
| PEOPLE (ACTS) : Following Procedures : Improper lifting or loading | 0 | 0 | 1 | 0 | 0 | 0 | 1 | 0 |
| PEOPLE (ACTS) : Following Procedures : Improper position (in the line of fire) | 0 | 4 | 0 | 2 | 0 | 1 | 0 | 0 |
| PEOPLE (ACTS) : Following Procedures : Deviation unintentional (by individual or group) | 2 | 0 | 4 | 1 | 0 | 1 | 0 | 0 |
| PEOPLE (ACTS) : Following Procedures : Deviation intentional (by individual or group) | 0 | 0 | 0 | 0 | 0 | 1 | 0 | 0 |
| PEOPLE (ACTS) : Use of Protective Methods : Personal Protective Equipment not used or used improperly | 2 | 0 | 0 | 0 | 1 | 0 | 0 | 0 |
| PEOPLE (ACTS) : Use of Protective Methods : Failure to warn of hazard | 1 | 0 | 2 | 1 | 0 | 0 | 0 | 0 |
| PROCESS (CONDITIONS) : Protective Systems : Inadequate/defective warning systems/safety devices | 2 | 2 | 1 | 1 | 0 | 0 | 0 | 0 |
| PEOPLE (ACTS) : Use of Protective Methods : Disabled or removed guards, warning systems or safety devices | 1 | 0 | 0 | 1 | 0 | 0 | 0 | 0 |
| PROCESS (CONDITIONS) : Work Place Hazards : Inadequate surfaces, floors, walkways or roads | 0 | 1 | 1 | 0 | 0 | 0 | 0 | 0 |
| PROCESS (CONDITIONS) : Protective Systems : Inadequate/defective Personal Protective Equipment | 1 | 0 | 1 | 0 | 0 | 0 | 0 | 0 |
| PROCESS (CONDITIONS) : Work Place Hazards : Congestion, clutter or restricted motion | 0 | 0 | 1 | 0 | 0 | 0 | 0 | 0 |
| PROCESS (CONDITIONS) : Organizational : Poor leadership/organizational culture | 1 | 1 | 0 | 0 | 0 | 0 | 0 | 0 |
| PROCESS (CONDITIONS) : Work Place Hazards : Storms or acts of nature | 0 | 0 | 0 | 0 | 0 | 0 | 0 | 0 |
| PROCESS (CONDITIONS) : Protective Systems : Inadequate security provisions or systems | 0 | 0 | 0 | 0 | 0 | 0 | 0 | 0 |
| PEOPLE (ACTS) : Inattention/Lack of Awareness : Acts of violence | 0 | 0 | 0 | 0 | 0 | 0 | 0 | 0 |
| PEOPLE (ACTS) : Inattention/Lack of Awareness : Use of drugs or alcohol | 0 | 0 | 0 | 0 | 0 | 0 | 0 | 0 |
| PEOPLE (ACTS) : Inattention/Lack of Awareness : Fatigue | 0 | 0 | 0 | 0 | 0 | 0 | 0 | 0 |
| PEOPLE (ACTS) : Following Procedures : Overexertion or improper position/posture for task | 0 | 0 | 0 | 0 | 0 | 0 | 0 | 0 |
| PEOPLE (ACTS) : Following Procedures : Work or motion at improper speed | 0 | 0 | 0 | 0 | 0 | 0 | 0 | 0 |
| Causal factors assigned to Tier 1 PSE – production | 2014 | 2015 | 2016 | 2017 | 2018 | 2019 | 2020 | 2021 |
|---|---|---|---|---|---|---|---|---|
| PROCESS (CONDITIONS) : Tools, Equipment, Materials and Products : Inadequate maintenance/inspection/testing | 58 | 63 | 54 | 67 | 47 | 50 | 57 | 50 |
| PROCESS (CONDITIONS) : Tools, Equipment, Materials and Products : Inadequate design/specification/management of change | 40 | 37 | 60 | 27 | 34 | 46 | 51 | 31 |
| PROCESS (CONDITIONS) : Organizational : Inadequate hazard identification or risk assessment | 44 | 27 | 40 | 20 | 27 | 22 | 41 | 24 |
| PROCESS (CONDITIONS) : Tools, Equipment, Materials and Products : Inadequate/defective tools/equipment/materials/products | 34 | 45 | 44 | 23 | 61 | 36 | 48 | 21 |
| PROCESS (CONDITIONS) : Organizational : Inadequate work standards/procedures | 24 | 27 | 37 | 21 | 23 | 27 | 38 | 19 |
| PEOPLE (ACTS) : Following Procedures : Deviation unintentional (by individual or group) | 21 | 8 | 29 | 10 | 15 | 25 | 18 | 12 |
| PROCESS (CONDITIONS) : Organizational : Inadequate training/competence | 21 | 12 | 21 | 13 | 14 | 9 | 19 | 10 |
| PROCESS (CONDITIONS) : Organizational : Inadequate communication | 8 | 11 | 14 | 10 | 10 | 11 | 17 | 9 |
| PROCESS (CONDITIONS) : Work Place Hazards : Storms or acts of nature | 3 | 9 | 11 | 3 | 17 | 11 | 4 | 9 |
| PEOPLE (ACTS) : Inattention/Lack of Awareness : Improper decision making or lack of judgment | 10 | 12 | 11 | 8 | 9 | 8 | 13 | 8 |
| PROCESS (CONDITIONS) : Organizational : Inadequate supervision | 16 | 9 | 20 | 10 | 11 | 10 | 9 | 8 |
| PROCESS (CONDITIONS) : Protective Systems : Inadequate/defective guards or protective barriers | 11 | 19 | 13 | 15 | 8 | 16 | 16 | 7 |
| PROCESS (CONDITIONS) : Protective Systems : Inadequate/defective warning systems/safety devices | 8 | 7 | 16 | 17 | 14 | 20 | 13 | 6 |
| PEOPLE (ACTS) : Inattention/Lack of Awareness : Lack of attention/distracted by other concerns/stress | 6 | 8 | 7 | 6 | 5 | 11 | 10 | 5 |
| PEOPLE (ACTS) : Following Procedures : Deviation intentional (by individual or group) | 1 | 3 | 3 | 0 | 3 | 3 | 1 | 5 |
| PEOPLE (ACTS) : Use of Protective Methods : Failure to warn of hazard | 2 | 3 | 7 | 6 | 3 | 5 | 11 | 4 |
| PEOPLE (ACTS) : Use of Tools, Equipment, Materials and Products : Improper use/position of tools/equipment/materials/products | 9 | 4 | 5 | 3 | 3 | 6 | 8 | 4 |
| PEOPLE (ACTS) : Use of Tools, Equipment, Materials and Products : Servicing of energized equipment/inadequate energy isolation | 2 | 3 | 4 | 2 | 1 | 6 | 8 | 3 |
| PROCESS (CONDITIONS) : Protective Systems : Inadequate security provisions or systems | 0 | 1 | 2 | 1 | 0 | 2 | 2 | 3 |
| PROCESS (CONDITIONS) : Protective Systems : Inadequate/defective Personal Protective Equipment | 1 | 1 | 3 | 0 | 5 | 0 | 1 | 3 |
| PEOPLE (ACTS) : Following Procedures : Improper position (in the line of fire) | 2 | 1 | 1 | 2 | 4 | 5 | 6 | 2 |
| PEOPLE (ACTS) : Use of Protective Methods : Equipment or materials not secured | 2 | 2 | 4 | 1 | 1 | 4 | 4 | 2 |
| PEOPLE (ACTS) : Use of Protective Methods : Inadequate use of safety systems | 1 | 3 | 6 | 2 | 4 | 1 | 2 | 2 |
| PEOPLE (ACTS) : Use of Protective Methods : Personal Protective Equipment not used or used improperly | 1 | 1 | 1 | 2 | 1 | 1 | 1 | 2 |
| PEOPLE (ACTS) : Use of Protective Methods : Disabled or removed guards, warning systems or safety devices | 2 | 4 | 2 | 2 | 2 | 0 | 1 | 2 |
| PROCESS (CONDITIONS) : Organizational : Poor leadership/organizational culture | 8 | 5 | 2 | 2 | 1 | 0 | 4 | 1 |
| PROCESS (CONDITIONS) : Work Place Hazards : Hazardous atmosphere (explosive/toxic/asphyxiant) | 3 | 2 | 3 | 9 | 4 | 3 | 3 | 1 |
| PEOPLE (ACTS) : Following Procedures : Improper lifting or loading | 0 | 0 | 1 | 0 | 2 | 1 | 3 | 1 |
| PEOPLE (ACTS) : Following Procedures : Work or motion at improper speed | 1 | 0 | 0 | 0 | 0 | 0 | 2 | 1 |
| PROCESS (CONDITIONS) : Organizational : Failure to report/learn from events | 4 | 9 | 4 | 3 | 3 | 4 | 9 | 0 |
| PEOPLE (ACTS) : Inattention/Lack of Awareness : Acts of violence | 0 | 0 | 0 | 0 | 0 | 0 | 4 | 0 |
| PEOPLE (ACTS) : Following Procedures : Overexertion or improper position/posture for task | 0 | 0 | 0 | 0 | 0 | 1 | 2 | 0 |
| PEOPLE (ACTS) : Inattention/Lack of Awareness : Fatigue | 0 | 1 | 1 | 0 | 0 | 1 | 1 | 0 |
| PROCESS (CONDITIONS) : Work Place Hazards : Inadequate surfaces, floors, walkways or roads | 2 | 1 | 1 | 1 | 1 | 0 | 1 | 0 |
| PROCESS (CONDITIONS) : Work Place Hazards : Congestion, clutter or restricted motion | 2 | 0 | 0 | 1 | 0 | 0 | 0 | 0 |
| PEOPLE (ACTS) : Inattention/Lack of Awareness : Use of drugs or alcohol | 0 | 0 | 0 | 0 | 0 | 0 | 0 | 0 |
| Causal factors assigned to fatal incidents | 2014 | 2015 | 2016 | 2017 | 2018 | 2019 | 2020 | 2021 |
|---|---|---|---|---|---|---|---|---|
| PROCESS (CONDITIONS) : Organizational : Inadequate hazard identification or risk assessment | 0 | 2 | 1 | 1 | 0 | 2 | 1 | 3 |
| PROCESS (CONDITIONS) : Work Place Hazards : Hazardous atmosphere (explosive/toxic/asphyxiant) | 0 | 0 | 0 | 0 | 0 | 1 | 1 | 2 |
| PROCESS (CONDITIONS) : Organizational : Inadequate supervision | 1 | 1 | 0 | 0 | 0 | 1 | 1 | 1 |
| PROCESS (CONDITIONS) : Organizational : Inadequate training/competence | 0 | 1 | 0 | 0 | 0 | 1 | 1 | 1 |
| PEOPLE (ACTS) : Inattention/Lack of Awareness : Improper decision making or lack of judgment | 1 | 1 | 0 | 0 | 0 | 1 | 0 | 1 |
| PEOPLE (ACTS) : Following Procedures : Deviation unintentional (by individual or group) | 0 | 1 | 0 | 0 | 0 | 1 | 0 | 1 |
| PROCESS (CONDITIONS) : Tools, Equipment, Materials and Products : Inadequate maintenance/inspection/testing | 1 | 0 | 0 | 0 | 0 | 1 | 0 | 1 |
| PROCESS (CONDITIONS) : Organizational : Inadequate work standards/procedures | 1 | 0 | 0 | 0 | 0 | 1 | 0 | 1 |
| PROCESS (CONDITIONS) : Organizational : Inadequate communication | 0 | 0 | 0 | 0 | 0 | 1 | 0 | 1 |
| PEOPLE (ACTS) : Use of Protective Methods : Failure to warn of hazard | 0 | 1 | 0 | 0 | 0 | 0 | 0 | 1 |
| PROCESS (CONDITIONS) : Tools, Equipment, Materials and Products : Inadequate design/specification/management of change | 0 | 1 | 0 | 0 | 0 | 0 | 0 | 1 |
| PROCESS (CONDITIONS) : Tools, Equipment, Materials and Products : Inadequate/defective tools/equipment/materials/products | 1 | 0 | 0 | 0 | 0 | 0 | 0 | 1 |
| PROCESS (CONDITIONS) : Protective Systems : Inadequate/defective warning systems/safety devices | 0 | 0 | 0 | 0 | 0 | 0 | 0 | 1 |
| PEOPLE (ACTS) : Use of Tools, Equipment, Materials and Products : Improper use/position of tools/equipment/materials/products | 0 | 0 | 0 | 0 | 0 | 0 | 0 | 1 |
| PEOPLE (ACTS) : Following Procedures : Improper position (in the line of fire) | 0 | 1 | 0 | 1 | 0 | 3 | 2 | 0 |
| PEOPLE (ACTS) : Use of Tools, Equipment, Materials and Products : Servicing of energized equipment/inadequate energy isolation | 0 | 1 | 0 | 0 | 0 | 1 | 1 | 0 |
| PEOPLE (ACTS) : Use of Protective Methods : Personal Protective Equipment not used or used improperly | 0 | 0 | 0 | 0 | 0 | 1 | 1 | 0 |
| PROCESS (CONDITIONS) : Work Place Hazards : Inadequate surfaces, floors, walkways or roads | 0 | 0 | 0 | 0 | 0 | 0 | 1 | 0 |
| PEOPLE (ACTS) : Following Procedures : Deviation intentional (by individual or group) | 0 | 0 | 0 | 0 | 0 | 1 | 0 | 0 |
| PEOPLE (ACTS) : Use of Protective Methods : Equipment or materials not secured | 0 | 0 | 1 | 0 | 0 | 0 | 0 | 0 |
| PROCESS (CONDITIONS) : Work Place Hazards : Storms or acts of nature | 0 | 1 | 0 | 0 | 0 | 0 | 0 | 0 |
| PROCESS (CONDITIONS) : Organizational : Failure to report/learn from events | 0 | 1 | 0 | 0 | 0 | 0 | 0 | 0 |
| PEOPLE (ACTS) : Use of Protective Methods : Inadequate use of safety systems | 1 | 0 | 0 | 0 | 0 | 0 | 0 | 0 |
| PROCESS (CONDITIONS) : Protective Systems : Inadequate/defective guards or protective barriers | 1 | 0 | 0 | 0 | 0 | 0 | 0 | 0 |
| PEOPLE (ACTS) : Use of Protective Methods : Disabled or removed guards, warning systems or safety devices | 0 | 0 | 0 | 0 | 0 | 0 | 0 | 0 |
| PEOPLE (ACTS) : Inattention/Lack of Awareness : Fatigue | 0 | 0 | 0 | 0 | 0 | 0 | 0 | 0 |
| PROCESS (CONDITIONS) : Protective Systems : Inadequate/defective Personal Protective Equipment | 0 | 0 | 0 | 0 | 0 | 0 | 0 | 0 |
| PROCESS (CONDITIONS) : Protective Systems : Inadequate security provisions or systems | 0 | 0 | 0 | 0 | 0 | 0 | 0 | 0 |
| PEOPLE (ACTS) : Inattention/Lack of Awareness : Lack of attention/distracted by other concerns/stress | 0 | 0 | 0 | 0 | 0 | 0 | 0 | 0 |
| PEOPLE (ACTS) : Inattention/Lack of Awareness : Acts of violence | 0 | 0 | 0 | 0 | 0 | 0 | 0 | 0 |
| PEOPLE (ACTS) : Inattention/Lack of Awareness : Use of drugs or alcohol | 0 | 0 | 0 | 0 | 0 | 0 | 0 | 0 |
| PEOPLE (ACTS) : Following Procedures : Overexertion or improper position/posture for task | 0 | 0 | 0 | 0 | 0 | 0 | 0 | 0 |
| PEOPLE (ACTS) : Following Procedures : Work or motion at improper speed | 0 | 0 | 0 | 0 | 0 | 0 | 0 | 0 |
| PEOPLE (ACTS) : Following Procedures : Improper lifting or loading | 0 | 0 | 0 | 0 | 0 | 0 | 0 | 0 |
| PROCESS (CONDITIONS) : Work Place Hazards : Congestion, clutter or restricted motion | 0 | 0 | 0 | 0 | 0 | 0 | 0 | 0 |
| PROCESS (CONDITIONS) : Organizational : Poor leadership/organizational culture | 0 | 0 | 0 | 0 | 0 | 0 | 0 | 0 |
Note: Includes Tier 1 PSE reported as fatal incidents in the safety performance database by companies that did not participate in the process safety event data collection.
| Causal factors assigned to high potential events | 2014 | 2015 | 2016 | 2017 | 2018 | 2019 | 2020 | 2021 |
|---|---|---|---|---|---|---|---|---|
| PROCESS (CONDITIONS) : Organizational : Inadequate hazard identification or risk assessment | 5 | 2 | 4 | 3 | 2 | 5 | 4 | 2 |
| PROCESS (CONDITIONS) : Organizational : Inadequate work standards/procedures | 2 | 4 | 4 | 4 | 4 | 5 | 3 | 2 |
| PROCESS (CONDITIONS) : Work Place Hazards : Hazardous atmosphere (explosive/toxic/asphyxiant) | 1 | 2 | 1 | 2 | 0 | 0 | 1 | 2 |
| PROCESS (CONDITIONS) : Tools, Equipment, Materials and Products : Inadequate design/specification/management of change | 2 | 4 | 4 | 4 | 4 | 2 | 6 | 1 |
| PEOPLE (ACTS) : Inattention/Lack of Awareness : Improper decision making or lack of judgment | 1 | 1 | 4 | 3 | 1 | 1 | 1 | 1 |
| PEOPLE (ACTS) : Following Procedures : Improper position (in the line of fire) | 0 | 1 | 0 | 0 | 0 | 0 | 0 | 1 |
| PEOPLE (ACTS) : Use of Protective Methods : Disabled or removed guards, warning systems or safety devices | 0 | 0 | 0 | 0 | 0 | 0 | 0 | 1 |
| PROCESS (CONDITIONS) : Tools, Equipment, Materials and Products : Inadequate maintenance/inspection/testing | 5 | 6 | 3 | 4 | 2 | 1 | 4 | 0 |
| PROCESS (CONDITIONS) : Organizational : Inadequate training/competence | 2 | 4 | 3 | 3 | 2 | 2 | 2 | 0 |
| PROCESS (CONDITIONS) : Organizational : Inadequate communication | 2 | 2 | 3 | 5 | 0 | 1 | 2 | 0 |
| PEOPLE (ACTS) : Following Procedures : Deviation unintentional (by individual or group) | 1 | 1 | 2 | 0 | 0 | 1 | 2 | 0 |
| PEOPLE (ACTS) : Use of Tools, Equipment, Materials and Products : Servicing of energized equipment/inadequate energy isolation | 0 | 1 | 3 | 0 | 0 | 0 | 2 | 0 |
| PROCESS (CONDITIONS) : Tools, Equipment, Materials and Products : Inadequate/defective tools/equipment/materials/products | 1 | 3 | 2 | 2 | 1 | 3 | 1 | 0 |
| PROCESS (CONDITIONS) : Organizational : Failure to report/learn from events | 0 | 1 | 0 | 1 | 2 | 0 | 1 | 0 |
| PEOPLE (ACTS) : Use of Protective Methods : Inadequate use of safety systems | 0 | 2 | 0 | 2 | 0 | 2 | 0 | 0 |
| PEOPLE (ACTS) : Use of Protective Methods : Equipment or materials not secured | 0 | 0 | 2 | 0 | 0 | 2 | 0 | 0 |
| PEOPLE (ACTS) : Use of Tools, Equipment, Materials and Products : Improper use/position of tools/equipment/materials/products | 0 | 1 | 0 | 1 | 3 | 1 | 0 | 0 |
| PROCESS (CONDITIONS) : Protective Systems : Inadequate/defective guards or protective barriers | 2 | 1 | 1 | 0 | 2 | 1 | 0 | 0 |
| PEOPLE (ACTS) : Use of Protective Methods : Failure to warn of hazard | 0 | 1 | 1 | 2 | 1 | 1 | 0 | 0 |
| PEOPLE (ACTS) : Inattention/Lack of Awareness : Lack of attention/distracted by other concerns/stress | 1 | 1 | 0 | 0 | 0 | 1 | 0 | 0 |
| PROCESS (CONDITIONS) : Protective Systems : Inadequate/defective warning systems/safety devices | 2 | 2 | 2 | 3 | 2 | 0 | 0 | 0 |
| PROCESS (CONDITIONS) : Organizational : Inadequate supervision | 1 | 0 | 4 | 2 | 2 | 0 | 0 | 0 |
| PEOPLE (ACTS) : Following Procedures : Deviation intentional (by individual or group) | 0 | 0 | 2 | 0 | 2 | 0 | 0 | 0 |
| PROCESS (CONDITIONS) : Protective Systems : Inadequate/defective Personal Protective Equipment | 0 | 0 | 1 | 0 | 1 | 0 | 0 | 0 |
| PEOPLE (ACTS) : Following Procedures : Overexertion or improper position/posture for task | 0 | 0 | 0 | 1 | 0 | 0 | 0 | 0 |
| PEOPLE (ACTS) : Use of Protective Methods : Personal Protective Equipment not used or used improperly | 0 | 0 | 1 | 0 | 0 | 0 | 0 | 0 |
| PROCESS (CONDITIONS) : Work Place Hazards : Congestion, clutter or restricted motion | 0 | 0 | 1 | 0 | 0 | 0 | 0 | 0 |
| PROCESS (CONDITIONS) : Organizational : Poor leadership/organizational culture | 0 | 1 | 0 | 0 | 0 | 0 | 0 | 0 |
| PROCESS (CONDITIONS) : Protective Systems : Inadequate security provisions or systems | 0 | 1 | 0 | 0 | 0 | 0 | 0 | 0 |
| PROCESS (CONDITIONS) : Work Place Hazards : Storms or acts of nature | 0 | 0 | 0 | 0 | 0 | 0 | 0 | 0 |
| PROCESS (CONDITIONS) : Work Place Hazards : Inadequate surfaces, floors, walkways or roads | 0 | 0 | 0 | 0 | 0 | 0 | 0 | 0 |
| PEOPLE (ACTS) : Following Procedures : Work or motion at improper speed | 0 | 0 | 0 | 0 | 0 | 0 | 0 | 0 |
| PEOPLE (ACTS) : Following Procedures : Improper lifting or loading | 0 | 0 | 0 | 0 | 0 | 0 | 0 | 0 |
| PEOPLE (ACTS) : Inattention/Lack of Awareness : Acts of violence | 0 | 0 | 0 | 0 | 0 | 0 | 0 | 0 |
| PEOPLE (ACTS) : Inattention/Lack of Awareness : Use of drugs or alcohol | 0 | 0 | 0 | 0 | 0 | 0 | 0 | 0 |
| PEOPLE (ACTS) : Inattention/Lack of Awareness : Fatigue | 0 | 0 | 0 | 0 | 0 | 0 | 0 | 0 |
Note: In 2017, Member Companies were asked to submit additional high potential events for 2010-2016. In 2018, some changes were made to causal factors assigned to 2017 high potential events. Therefore, the figures in the table above are different to those previously published.
Section 2 Results by function
| Year | Location | Number of drilling PSE | Number of drilling PSE for normalized results* | PSE rate (PSE per million work hours)* - drilling | |||
|---|---|---|---|---|---|---|---|
| Tier 1 | Tier 2 | Tier 1 | Tier 2 | Tier 1 | Tier 2 | ||
| 2015 | Onshore | 9 | 23 | 7 | 21 | 0.03 | 0.07 |
| 2015 | Offshore | 3 | 24 | 3 | 22 | 0.02 | 0.13 |
| 2015 | OVERALL | 12 | 47 | 10 | 43 | 0.02 | 0.09 |
| 2016 | Onshore | 7 | 15 | 7 | 13 | 0.04 | 0.08 |
| 2016 | Offshore | 3 | 19 | 3 | 17 | 0.02 | 0.16 |
| 2016 | OVERALL | 10 | 34 | 10 | 30 | 0.03 | 0.11 |
| 2017 | Onshore | 8 | 20 | 8 | 20 | 0.04 | 0.09 |
| 2017 | Offshore | 8 | 31 | 8 | 30 | 0.06 | 0.24 |
| 2017 | OVERALL | 16 | 51 | 16 | 50 | 0.05 | 0.15 |
| 2018 | Onshore | 11 | 22 | 9 | 21 | 0.05 | 0.11 |
| 2018 | Offshore | 2 | 16 | 2 | 15 | 0.02 | 0.13 |
| 2018 | OVERALL | 13 | 38 | 11 | 36 | 0.03 | 0.12 |
| 2019 | Onshore | 9 | 30 | 8 | 29 | 0.03 | 0.12 |
| 2019 | Offshore | 1 | 12 | 1 | 12 | 0.01 | 0.08 |
| 2019 | OVERALL | 10 | 42 | 9 | 41 | 0.02 | 0.11 |
| 2020 | Onshore | 6 | 18 | 5 | 10 | 0.03 | 0.06 |
| 2020 | Offshore | 1 | 14 | 1 | 11 | 0.01 | 0.09 |
| 2020 | OVERALL | 7 | 32 | 6 | 21 | 0.02 | 0.07 |
| 2021 | Onshore | 6 | 31 | 6 | 31 | 0.03 | 0.16 |
| 2021 | Offshore | 0 | 6 | 0 | 6 | 0.00 | 0.05 |
| 2021 | OVERALL | 6 | 37 | 6 | 37 | 0.02 | 0.11 |
| 2022 | Onshore | 9 | 16 | 3 | 9 | 0.02 | 0.06 |
| 2022 | Offshore | 2 | 5 | 2 | 5 | 0.01 | 0.04 |
| 2022 | OVERALL | 11 | 21 | 5 | 14 | 0.02 | 0.05 |
| 2023 | Onshore | 11 | 33 | 10 | 20 | 0.03 | 0.07 |
| 2023 | Offshore | 3 | 9 | 3 | 9 | 0.02 | 0.05 |
| 2023 | OVERALL | 14 | 42 | 13 | 29 | 0.03 | 0.06 |
| 2024 | Onshore | 4 | 12 | 4 | 12 | 0.01 | 0.03 |
| 2024 | Offshore | 2 | 7 | 2 | 7 | 0.01 | 0.03 |
| 2024 | OVERALL | 6 | 19 | 6 | 19 | 0.01 | 0.03 |
For related work hours for normalized results, see Scope table below.
| Year | Location | Companies reporting PSE data – drilling | Related work hours (millions)* – drilling | Data sets – drilling | |||
|---|---|---|---|---|---|---|---|
| Tier 1 | Tier 2 | Tier 1 | Tier 2 | Tier 1 | Tier 2 | ||
| 2015 | Onshore | 42 | 43 | 258 | 301 | 406 | 406 |
| 2015 | Offshore | 40 | 41 | 160 | 174 | 155 | 153 |
| 2015 | OVERALL | 42 | 43 | 418 | 476 | 561 | 559 |
| 2016 | Onshore | 38 | 38 | 177 | 172 | 328 | 321 |
| 2016 | Offshore | 36 | 38 | 127 | 109 | 123 | 122 |
| 2016 | OVERALL | 39 | 39 | 304 | 281 | 451 | 443 |
| 2017 | Onshore | 41 | 40 | 214 | 212 | 335 | 346 |
| 2017 | Offshore | 39 | 38 | 127 | 127 | 150 | 149 |
| 2017 | OVERALL | 41 | 40 | 341 | 339 | 485 | 495 |
| 2018 | Onshore | 41 | 39 | 197 | 193 | 367 | 359 |
| 2018 | Offshore | 40 | 38 | 121 | 116 | 168 | 161 |
| 2018 | OVERALL | 41 | 39 | 318 | 309 | 535 | 520 |
| 2019 | Onshore | 46 | 46 | 229 | 240 | 327 | 323 |
| 2019 | Offshore | 44 | 44 | 149 | 148 | 143 | 143 |
| 2019 | OVERALL | 46 | 46 | 378 | 387 | 470 | 466 |
| 2020 | Onshore | 33 | 33 | 179 | 179 | 154 | 154 |
| 2020 | Offshore | 29 | 29 | 128 | 128 | 102 | 103 |
| 2020 | OVERALL | 38 | 38 | 307 | 307 | 256 | 257 |
| 2021 | Onshore | 30 | 30 | 195 | 195 | 150 | 150 |
| 2021 | Offshore | 26 | 26 | 131 | 131 | 98 | 98 |
| 2021 | OVERALL | 37 | 37 | 326 | 326 | 248 | 248 |
| 2022 | Onshore | 32 | 32 | 153 | 153 | 141 | 141 |
| 2022 | Offshore | 29 | 29 | 142 | 142 | 105 | 105 |
| 2022 | OVERALL | 36 | 36 | 295 | 295 | 246 | 246 |
| 2023 | Onshore | 37 | 37 | 293 | 293 | 134 | 134 |
| 2023 | Offshore | 31 | 31 | 194 | 194 | 104 | 105 |
| 2023 | OVERALL | 43 | 43 | 487 | 487 | 238 | 239 |
| 2024 | Onshore | 35 | 35 | 376 | 376 | 131 | 131 |
| 2024 | Offshore | 32 | 32 | 227 | 227 | 96 | 95 |
| 2024 | OVERALL | 41 | 41 | 602 | 602 | 227 | 226 |
| Year | Location | Number of production PSE | Number of production PSE for normalized results* | PSE rate (PSE per million work hours)* - production | |||
|---|---|---|---|---|---|---|---|
| Tier 1 | Tier 2 | Tier 1 | Tier 2 | Tier 1 | Tier 2 | ||
| 2015 | Onshore | 211 | 607 | 176 | 519 | 0.25 | 0.69 |
| 2015 | Offshore | 31 | 141 | 30 | 138 | 0.07 | 0.39 |
| 2015 | OVERALL | 242 | 748 | 206 | 657 | 0.19 | 0.59 |
| 2016 | Onshore | 148 | 425 | 133 | 314 | 0.25 | 0.60 |
| 2016 | Offshore | 34 | 256 | 33 | 100 | 0.13 | 0.48 |
| 2016 | OVERALL | 182 | 681 | 166 | 414 | 0.21 | 0.56 |
| 2017 | Onshore | 135 | 414 | 131 | 356 | 0.17 | 0.47 |
| 2017 | Offshore | 41 | 152 | 40 | 152 | 0.11 | 0.43 |
| 2017 | OVERALL | 176 | 566 | 171 | 508 | 0.15 | 0.46 |
| 2018 | Onshore | 215 | 424 | 199 | 380 | 0.24 | 0.48 |
| 2018 | Offshore | 28 | 145 | 28 | 139 | 0.08 | 0.42 |
| 2018 | OVERALL | 243 | 569 | 227 | 519 | 0.19 | 0.46 |
| 2019 | Onshore | 215 | 634 | 201 | 572 | 0.22 | 0.62 |
| 2019 | Offshore | 36 | 119 | 36 | 116 | 0.09 | 0.28 |
| 2019 | OVERALL | 251 | 753 | 237 | 688 | 0.18 | 0.51 |
| 2020 | Onshore | 152 | 398 | 142 | 360 | 0.19 | 0.48 |
| 2020 | Offshore | 25 | 106 | 25 | 105 | 0.07 | 0.30 |
| 2020 | OVERALL | 177 | 504 | 167 | 465 | 0.15 | 0.42 |
| 2021 | Onshore | 166 | 498 | 166 | 490 | 0.19 | 0.56 |
| 2021 | Offshore | 21 | 87 | 21 | 87 | 0.05 | 0.22 |
| 2021 | OVERALL | 187 | 585 | 187 | 577 | 0.15 | 0.45 |
| 2022 | Onshore | 139 | 469 | 139 | 469 | 0.18 | 0.61 |
| 2022 | Offshore | 32 | 73 | 32 | 73 | 0.07 | 0.17 |
| 2022 | OVERALL | 171 | 542 | 171 | 542 | 0.14 | 0.45 |
| 2023 | Onshore | 160 | 497 | 160 | 497 | 0.17 | 0.52 |
| 2023 | Offshore | 44 | 81 | 44 | 81 | 0.09 | 0.16 |
| 2023 | OVERALL | 204 | 578 | 204 | 578 | 0.14 | 0.40 |
| 2024 | Onshore | 153 | 598 | 150 | 511 | 0.13 | 0.44 |
| 2024 | Offshore | 29 | 108 | 29 | 108 | 0.06 | 0.23 |
| 2024 | OVERALL | 182 | 706 | 179 | 619 | 0.11 | 0.38 |
For related work hours for normalized results, see Scope table below.
| Year | Location | Companies reporting PSE data – production | Related work hours (millions)* – production | Data sets – production | |||
|---|---|---|---|---|---|---|---|
| Tier 1 | Tier 2 | Tier 1 | Tier 2 | Tier 1 | Tier 2 | ||
| 2015 | Onshore | 43 | 44 | 701 | 756 | 425 | 425 |
| 2015 | Offshore | 42 | 41 | 403 | 356 | 152 | 150 |
| 2015 | OVERALL | 44 | 44 | 1,104 | 1,112 | 577 | 575 |
| 2016 | Onshore | 39 | 39 | 539 | 527 | 353 | 339 |
| 2016 | Offshore | 37 | 38 | 253 | 208 | 120 | 116 |
| 2016 | OVERALL | 39 | 39 | 792 | 734 | 473 | 455 |
| 2017 | Onshore | 43 | 43 | 754 | 752 | 350 | 357 |
| 2017 | Offshore | 41 | 40 | 355 | 353 | 154 | 153 |
| 2017 | OVERALL | 43 | 43 | 1,108 | 1,105 | 504 | 510 |
| 2018 | Onshore | 42 | 41 | 840 | 799 | 373 | 364 |
| 2018 | Offshore | 40 | 37 | 338 | 331 | 173 | 166 |
| 2018 | OVERALL | 42 | 41 | 1,177 | 1,131 | 546 | 530 |
| 2019 | Onshore | 47 | 47 | 923 | 926 | 350 | 345 |
| 2019 | Offshore | 44 | 44 | 411 | 411 | 143 | 138 |
| 2019 | OVERALL | 47 | 47 | 1,334 | 1,337 | 493 | 483 |
| 2020 | Onshore | 38 | 37 | 747 | 747 | 187 | 186 |
| 2020 | Offshore | 31 | 31 | 352 | 352 | 105 | 105 |
| 2020 | OVERALL | 41 | 40 | 1,099 | 1,099 | 292 | 291 |
| 2021 | Onshore | 41 | 41 | 880 | 880 | 195 | 196 |
| 2021 | Offshore | 33 | 33 | 397 | 397 | 115 | 115 |
| 2021 | OVERALL | 44 | 44 | 1,278 | 1,278 | 310 | 311 |
| 2022 | Onshore | 45 | 45 | 772 | 772 | 208 | 208 |
| 2022 | Offshore | 38 | 38 | 442 | 442 | 117 | 117 |
| 2022 | OVERALL | 47 | 47 | 1,214 | 1,214 | 325 | 325 |
| 2023 | Onshore | 49 | 49 | 957 | 957 | 196 | 196 |
| 2023 | Offshore | 40 | 40 | 494 | 494 | 115 | 115 |
| 2023 | OVERALL | 51 | 51 | 1,452 | 1,452 | 311 | 311 |
| 2024 | Onshore | 44 | 44 | 1,154 | 1,154 | 179 | 181 |
| 2024 | Offshore | 36 | 36 | 477 | 477 | 104 | 104 |
| 2024 | OVERALL | 47 | 47 | 1,632 | 1,632 | 283 | 285 |
Section 3 Results by activity
| TIER 1 | Normal operations | Start up | Shut down | Other | Unspecified |
|---|---|---|---|---|---|
| 2015 | 164 | 11 | 5 | 29 | 33 |
| 2016 | 101 | 10 | 12 | 22 | 37 |
| 2017 | 119 | 8 | 7 | 28 | 14 |
| 2018 | 181 | 10 | 4 | 24 | 24 |
| 2019 | 132 | 8 | 1 | 7 | 103 |
| 2020 | 143 | 6 | 3 | 24 | 1 |
| 2021 | 148 | 6 | 13 | 19 | 1 |
| 2022 | 144 | 7 | 4 | 16 | 0 |
| 2023 | 160 | 18 | 8 | 18 | 0 |
| 2024 | 126 | 15 | 10 | 22 | 9 |
| TIER 2 | Normal operations | Start up | Shut down | Other | Unspecified |
|---|---|---|---|---|---|
| 2015 | 556 | 34 | 11 | 67 | 80 |
| 2016 | 349 | 18 | 6 | 60 | 248 |
| 2017 | 423 | 11 | 10 | 48 | 74 |
| 2018 | 447 | 11 | 7 | 62 | 42 |
| 2019 | 425 | 14 | 4 | 16 | 294 |
| 2020 | 417 | 14 | 3 | 61 | 9 |
| 2021 | 438 | 40 | 6 | 92 | 9 |
| 2022 | 490 | 18 | 7 | 25 | 2 |
| 2023 | 483 | 29 | 16 | 49 | 1 |
| 2024 | 526 | 20 | 12 | 67 | 81 |
Section 4 Results by consequence
| Year | Number of consequences assigned to Tier 1 PSE | |||||
|---|---|---|---|---|---|---|
| Fatality or LWDC | Third party hospitalization | Community evacuation | Fire or explosion | PRD discharges | Material release | |
| 2015 | 23 | 0 | 1 | 27 | 13 | 195 |
| 2016 | 17 | 1 | 2 | 25 | 16 | 144 |
| 2017 | 16 | 0 | 2 | 14 | 8 | 151 |
| 2018 | 9 | 1 | 2 | 15 | 5 | 221 |
| 2019 | 10 | 1 | 1 | 15 | 15 | 225 |
| 2020 | 11 | 3 | 0 | 14 | 6 | 168 |
| 2021 | 13 | 1 | 3 | 20 | 11 | 179 |
| 2022 | 16 | 0 | 0 | 19 | 6 | 145 |
| 2023 | 27 | 0 | 2 | 19 | 16 | 170 |
| 2024 | 15 | 0 | 0 | 11 | 5 | 158 |
| Year | Number of consequences assigned to Tier 2 PSE | |||
|---|---|---|---|---|
| Recordable injury | Fire or explosion | PRD discharges | Material release | |
| 2015 | 14 | 49 | 35 | 660 |
| 2016 | 8 | 53 | 19 | 635 |
| 2017 | 6 | 48 | 17 | 534 |
| 2018 | 9 | 56 | 14 | 497 |
| 2019 | 8 | 64 | 78 | 645 |
| 2020 | 2 | 36 | 21 | 504 |
| 2021 | 11 | 75 | 29 | 578 |
| 2022 | 13 | 55 | 24 | 493 |
| 2023 | 8 | 53 | 90 | 479 |
| 2024 | 7 | 62 | 13 | 656 |
| Year | Number of Employee/Contractor fatalities | Number of 3rd Party fatalities |
|---|---|---|
| 2015 | 17 | 0 |
| 2016 | 6 | 0 |
| 2017 | 5 | 0 |
| 2018 | 4 | 1 |
| 2019 | 1 | 0 |
| 2020 | 3 | 0 |
| 2021 | 0 | 0 |
| 2022 | 4 | 0 |
| 2023 | 5 | 0 |
| 2024 | 3 | 0 |
| TIER 1 | Percentage of total reported PSE where information on consequence was provided | Number of Companies reporting PSE data by consequence | Number of related work hours (millions) where PSE reported by consequence | Number of data sets where PSE reported by consequence |
|---|---|---|---|---|
| 2015 | 98% | 28 | 660 | 62 |
| 2016 | 99% | 22 | 510 | 61 |
| 2017 | 98% | 26 | 863 | 70 |
| 2018 | 98% | 28 | 794 | 59 |
| 2019 | 99% | 27 | 813 | 63 |
| 2020 | 100% | 27 | 619 | 55 |
| 2021 | 99% | 21 | 655 | 53 |
| 2022 | 100% | 23 | 570 | 47 |
| 2023 | 100% | 28 | 845 | 53 |
| 2024 | 98% | 31 | 965 | 45 |
| TIER 2 | Percentage of total reported PSE where information on consequence was provided | Number of Companies reporting PSE data by consequence | Number of related work hours (millions) where PSE reported by consequence | Number of data sets where PSE reported by consequence |
|---|---|---|---|---|
| 2015 | 95% | 32 | 838 | 117 |
| 2016 | 99% | 26 | 565 | 91 |
| 2017 | 98% | 27 | 900 | 103 |
| 2018 | 93% | 32 | 827 | 87 |
| 2019 | 99% | 34 | 1069 | 107 |
| 2020 | 100% | 30 | 860 | 101 |
| 2021 | 99% | 30 | 920 | 91 |
| 2022 | 100% | 33 | 768 | 72 |
| 2023 | 100% | 33 | 1015 | 77 |
| 2024 | 99% | 34 | 1158 | 82 |
Note 2: Related work hours were not provided for all reported PSE.
Section 5 Results by material
| TIER 1 | Toxics | Flammable gas | Hazardous liquid | Other gases or liquids | Unspecified |
|---|---|---|---|---|---|
| 2015 | 9 | 91 | 107 | 10 | 37 |
| 2016 | 5 | 63 | 76 | 8 | 40 |
| 2017 | 9 | 70 | 80 | 10 | 23 |
| 2018 | 3 | 54 | 158 | 9 | 32 |
| 2019 | 5 | 67 | 89 | 7 | 93 |
| 2020 | 6 | 61 | 76 | 20 | 21 |
| 2021 | 6 | 53 | 99 | 21 | 14 |
| 2022 | 5 | 63 | 92 | 16 | 6 |
| 2023 | 5 | 76 | 118 | 17 | 2 |
| 2024 | 12 | 72 | 83 | 15 | 6 |
| TIER 2 | Toxics | Flammable gas | Hazardous liquid | Other gases or liquids | Unspecified |
|---|---|---|---|---|---|
| 2015 | 12 | 237 | 396 | 54 | 96 |
| 2016 | 11 | 169 | 230 | 48 | 257 |
| 2017 | 20 | 175 | 246 | 76 | 100 |
| 2018 | 9 | 156 | 322 | 77 | 43 |
| 2019 | 5 | 169 | 296 | 56 | 269 |
| 2020 | 6 | 178 | 251 | 54 | 47 |
| 2021 | 9 | 168 | 293 | 108 | 44 |
| 2022 | 16 | 157 | 343 | 41 | 6 |
| 2023 | 10 | 143 | 425 | 43 | -1 |
| 2024 | 11 | 153 | 312 | 169 | 80 |
| TIER 1 | Number of Companies reporting PSE data by material released | Number of related work hours (millions) where PSE reported by material released | Number of data sets where PSE reported by material released |
|---|---|---|---|
| 2015 | 25 | 503 | 58 |
| 2016 | 20 | 457 | 51 |
| 2017 | 22 | 786 | 63 |
| 2018 | 26 | 583 | 51 |
| 2019 | 24 | 714 | 55 |
| 2020 | 25 | 544 | 48 |
| 2021 | 17 | 536 | 46 |
| 2022 | 22 | 565 | 45 |
| 2023 | 28 | 835 | 51 |
| 2024 | 31 | 982 | 47 |
| TIER 2 | Number of Companies reporting PSE data by material released | Number of related work hours (millions) where PSE reported by material released | Number of data sets where PSE reported by material released |
|---|---|---|---|
| 2015 | 31 | 808 | 113 |
| 2016 | 24 | 534 | 88 |
| 2017 | 26 | 838 | 99 |
| 2018 | 31 | 810 | 87 |
| 2019 | 28 | 934 | 90 |
| 2020 | 29 | 795 | 96 |
| 2021 | 29 | 902 | 86 |
| 2022 | 32 | 767 | 70 |
| 2023 | 33 | 1010 | 76 |
| 2024 | 34 | 1170 | 84 |
Note 2: Related work hours were not provided for all reported PSE.
Section 6 Results by Process Safety Fundamental
| Process Safety Fundamental | 2021 |
|---|---|
| We respect hazards. | 23 |
| We apply procedures. | 10 |
| We sustain barriers. | 26 |
| We stay within operating limits. | 14 |
| We maintain safe isolation. | 11 |
| We walk the line. | 12 |
| We control ignition sources. | 2 |
| We recognize change. | 7 |
| We stop if the unexpected occurs. | 3 |
| We watch for weak signals. | 13 |
| TOTAL ASSIGNED | 121 |
| Not applicable. | 63 |
| Unspecified. | 4 |
Section 7 Results by region
| Number of PSE | Africa | Asia/Australasia | Europe | Middle East | North America | Russia & Central Asia | South America | |
|---|---|---|---|---|---|---|---|---|
| 2015 | Tier 1 | 29 | 21 | 15 | 13 | 152 | 7 | 17 |
| 2015 | Tier 2 | 56 | 56 | 87 | 70 | 366 | 81 | 79 |
| 2016 | Tier 1 | 19 | 24 | 19 | 28 | 83 | 1 | 18 |
| 2016 | Tier 2 | 37 | 241 | 64 | 74 | 232 | 21 | 46 |
| 2017 | Tier 1 | 32 | 25 | 13 | 15 | 72 | 3 | 32 |
| 2017 | Tier 2 | 70 | 81 | 63 | 41 | 256 | 11 | 95 |
| 2018 | Tier 1 | 26 | 8 | 15 | 26 | 101 | 58 | 22 |
| 2018 | Tier 2 | 68 | 56 | 58 | 74 | 242 | 11 | 98 |
| 2019 | Tier 1 | 15 | 12 | 12 | 20 | 97 | 75 | 30 |
| 2019 | Tier 2 | 73 | 34 | 41 | 42 | 326 | 116 | 163 |
| 2020 | Tier 1 | 23 | 10 | 11 | 40 | 76 | 3 | 21 |
| 2020 | Tier 2 | 49 | 48 | 51 | 83 | 207 | 6 | 92 |
| 2021 | Tier 1 | 24 | 6 | 9 | 12 | 92 | 7 | 43 |
| 2021 | Tier 2 | 50 | 41 | 49 | 52 | 286 | 22 | 122 |
| 2022 | Tier 1 | 20 | 9 | 21 | 1 | 84 | 2 | 45 |
| 2022 | Tier 2 | 34 | 34 | 25 | 12 | 305 | 12 | 141 |
| 2023 | Tier 1 | 13 | 8 | 10 | 21 | 88 | 2 | 76 |
| 2023 | Tier 2 | 31 | 20 | 21 | 50 | 299 | 19 | 180 |
| 2024 | Tier 1 | 11 | 12 | 13 | 14 | 88 | 8 | 42 |
| 2024 | Tier 2 | 22 | 34 | 41 | 110 | 300 | 75 | 143 |
| Number of PSE for normalized results* | Africa | Asia/Australasia | Europe | Middle East | North America | Russia & Central Asia | South America | |
|---|---|---|---|---|---|---|---|---|
| 2015 | Tier 1 | 28 | 20 | 15 | 13 | 116 | 7 | 17 |
| 2015 | Tier 2 | 55 | 49 | 85 | 69 | 283 | 81 | 78 |
| 2016 | Tier 1 | 19 | 22 | 19 | 27 | 70 | 1 | 18 |
| 2016 | Tier 2 | 35 | 42 | 63 | 42 | 206 | 10 | 46 |
| 2017 | Tier 1 | 32 | 25 | 12 | 15 | 68 | 3 | 32 |
| 2017 | Tier 2 | 69 | 75 | 61 | 41 | 208 | 9 | 95 |
| 2018 | Tier 1 | 26 | 7 | 15 | 26 | 85 | 57 | 22 |
| 2018 | Tier 2 | 65 | 48 | 58 | 74 | 204 | 9 | 97 |
| 2019 | Tier 1 | 14 | 10 | 12 | 20 | 85 | 75 | 30 |
| 2019 | Tier 2 | 71 | 30 | 41 | 42 | 272 | 111 | 162 |
| 2020 | Tier 1 | 23 | 10 | 10 | 40 | 68 | 1 | 21 |
| 2020 | Tier 2 | 49 | 44 | 49 | 83 | 163 | 6 | 92 |
| 2021 | Tier 1 | 24 | 6 | 9 | 12 | 92 | 7 | 43 |
| 2021 | Tier 2 | 43 | 40 | 49 | 52 | 286 | 22 | 122 |
| 2022 | Tier 1 | 20 | 9 | 21 | 1 | 78 | 2 | 45 |
| 2022 | Tier 2 | 34 | 34 | 25 | 12 | 298 | 12 | 141 |
| 2023 | Tier 1 | 13 | 8 | 10 | 21 | 87 | 2 | 76 |
| 2023 | Tier 2 | 31 | 20 | 21 | 50 | 286 | 19 | 180 |
| 2024 | Tier 1 | 11 | 12 | 13 | 11 | 88 | 8 | 42 |
| 2024 | Tier 2 | 22 | 32 | 41 | 28 | 300 | 75 | 140 |
| Year | Tier | PSE per million work hours* | |||||||
|---|---|---|---|---|---|---|---|---|---|
| Africa | Asia/Australasia | Europe | Middle East | North America | Russia & Central Asia | South America | OVERALL | ||
| 2015 | Tier 1 | 0.14 | 0.07 | 0.08 | 0.05 | 0.29 | 0.06 | 0.20 | 0.14 |
| 2015 | Tier 2 | 0.28 | 0.21 | 0.46 | 0.29 | 0.53 | 0.67 | 0.94 | 0.44 |
| 2016 | Tier 1 | 0.12 | 0.08 | 0.12 | 0.12 | 0.42 | 0.01 | 0.29 | 0.16 |
| 2016 | Tier 2 | 0.23 | 0.22 | 0.41 | 0.19 | 1.24 | 0.14 | 0.75 | 0.44 |
| 2017 | Tier 1 | 0.15 | 0.13 | 0.08 | 0.04 | 0.38 | 0.03 | 0.12 | 0.13 |
| 2017 | Tier 2 | 0.32 | 0.38 | 0.43 | 0.12 | 1.16 | 0.08 | 0.37 | 0.39 |
| 2018 | Tier 1 | 0.11 | 0.03 | 0.11 | 0.07 | 0.48 | 0.52 | 0.09 | 0.16 |
| 2018 | Tier 2 | 0.28 | 0.23 | 0.45 | 0.20 | 1.16 | 0.12 | 0.39 | 0.39 |
| 2019 | Tier 1 | 0.05 | 0.03 | 0.08 | 0.06 | 0.39 | 0.59 | 0.10 | 0.14 |
| 2019 | Tier 2 | 0.27 | 0.10 | 0.26 | 0.12 | 1.24 | 0.88 | 0.54 | 0.42 |
| 2020 | Tier 1 | 0.12 | 0.03 | 0.08 | 0.13 | 0.54 | 0.01 | 0.10 | 0.12 |
| 2020 | Tier 2 | 0.25 | 0.14 | 0.37 | 0.26 | 1.29 | 0.06 | 0.42 | 0.35 |
| 2021 | Tier 1 | 0.12 | 0.02 | 0.06 | 0.03 | 0.48 | 0.05 | 0.18 | 0.12 |
| 2021 | Tier 2 | 0.22 | 0.13 | 0.34 | 0.14 | 1.48 | 0.14 | 0.50 | 0.38 |
| 2022 | Tier 1 | 0.09 | 0.03 | 0.12 | 0.00 | 0.36 | 0.02 | 0.19 | 0.12 |
| 2022 | Tier 2 | 0.16 | 0.12 | 0.15 | 0.04 | 1.36 | 0.11 | 0.60 | 0.37 |
| 2023 | Tier 1 | 0.06 | 0.02 | 0.06 | 0.04 | 0.35 | 0.02 | 0.29 | 0.11 |
| 2023 | Tier 2 | 0.14 | 0.06 | 0.12 | 0.09 | 1.13 | 0.17 | 0.69 | 0.31 |
| 2024 | Tier 1 | 0.04 | 0.03 | 0.08 | 0.02 | 0.30 | 0.06 | 0.14 | 0.08 |
| 2024 | Tier 2 | 0.08 | 0.07 | 0.25 | 0.05 | 1.03 | 0.61 | 0.47 | 0.29 |
| Year | Tier | Number of work hours (thousands) used in normalized analysis | |||||||
|---|---|---|---|---|---|---|---|---|---|
| Africa | Asia/Australasia | Europe | Middle East | North America | Russia & Central Asia | South America | OVERALL | ||
| 2015 | Tier 1 | 193,327 | 306,097 | 184,785 | 240,688 | 393,785 | 120,371 | 83,369 | 1,522,422 |
| 2015 | Tier 2 | 193,327 | 235,369 | 186,483 | 238,979 | 529,811 | 120,371 | 83,369 | 1,587,709 |
| 2016 | Tier 1 | 155,553 | 271,552 | 152,320 | 218,137 | 165,683 | 71,254 | 61,854 | 1,096,353 |
| 2016 | Tier 2 | 155,553 | 190,350 | 152,320 | 218,137 | 165,683 | 71,254 | 61,307 | 1,014,604 |
| 2017 | Tier 1 | 217,765 | 197,636 | 142,314 | 337,908 | 179,417 | 116,348 | 258,149 | 1,449,537 |
| 2017 | Tier 2 | 217,765 | 195,285 | 142,314 | 334,183 | 179,417 | 116,348 | 258,149 | 1,443,461 |
| 2018 | Tier 1 | 242,448 | 207,795 | 136,603 | 368,292 | 177,301 | 108,877 | 253,649 | 1,494,965 |
| 2018 | Tier 2 | 234,808 | 206,583 | 128,812 | 368,292 | 176,014 | 75,500 | 249,635 | 1,439,644 |
| 2019 | Tier 1 | 263,090 | 314,203 | 158,772 | 341,054 | 219,433 | 126,064 | 289,385 | 1,712,001 |
| 2019 | Tier 2 | 263,666 | 315,363 | 158,360 | 341,054 | 219,401 | 126,445 | 299,726 | 1,724,015 |
| 2020 | Tier 1 | 192,576 | 320,640 | 133,272 | 319,150 | 126,749 | 96,309 | 217,762 | 1,406,458 |
| 2020 | Tier 2 | 192,576 | 320,640 | 133,272 | 319,150 | 126,749 | 96,309 | 217,762 | 1,406,458 |
| 2021 | Tier 1 | 197,141 | 305,640 | 144,811 | 365,617 | 193,593 | 152,467 | 244,260 | 1,603,529 |
| 2021 | Tier 2 | 197,141 | 305,640 | 144,811 | 365,617 | 193,593 | 152,467 | 244,260 | 1,603,529 |
| 2022 | Tier 1 | 215,440 | 282,772 | 170,051 | 274,572 | 219,387 | 112,658 | 234,396 | 1,509,276 |
| 2022 | Tier 2 | 215,440 | 282,772 | 170,051 | 274,572 | 219,387 | 112,658 | 234,396 | 1,509,276 |
| 2023 | Tier 1 | 222,907 | 345,450 | 175,021 | 568,359 | 252,113 | 112,404 | 262,572 | 1,938,827 |
| 2023 | Tier 2 | 222,907 | 345,450 | 175,021 | 568,359 | 252,113 | 112,404 | 262,572 | 1,938,827 |
| 2024 | Tier 1 | 290,836 | 465,236 | 166,030 | 599,914 | 291,657 | 123,383 | 297,091 | 2,234,146 |
| 2024 | Tier 2 | 290,836 | 465,236 | 166,030 | 599,914 | 291,657 | 123,383 | 297,091 | 2,234,146 |
| Number of PSE | Africa | Asia/Australasia | Europe | Middle East | North America | Russia & Central Asia | South America | OVERALL | |
|---|---|---|---|---|---|---|---|---|---|
| 2015 | Tier 1 | 1.00 | 1.00 | 0.00 | 1.00 | 6.00 | 2.00 | 1.00 | 12.00 |
| 2015 | Tier 2 | 6.00 | 3.00 | 10.00 | 3.00 | 18.00 | 1.00 | 6.00 | 47.00 |
| 2016 | Tier 1 | 0.00 | 0.00 | 3.00 | 4.00 | 1.00 | 0.00 | 2.00 | 10.00 |
| 2016 | Tier 2 | 3.00 | 2.00 | 8.00 | 3.00 | 15.00 | 1.00 | 2.00 | 34.00 |
| 2017 | Tier 1 | 2.00 | 0.00 | 3.00 | 2.00 | 4.00 | 0.00 | 5.00 | 16.00 |
| 2017 | Tier 2 | 2.00 | 2.00 | 13.00 | 1.00 | 15.00 | 2.00 | 16.00 | 51.00 |
| 2018 | Tier 1 | 3.00 | 0.00 | 2.00 | 0.00 | 3.00 | 1.00 | 4.00 | 13.00 |
| 2018 | Tier 2 | 3.00 | 4.00 | 7.00 | 1.00 | 10.00 | 1.00 | 12.00 | 38.00 |
| 2019 | Tier 1 | 1.00 | 0.00 | 0.00 | 0.00 | 7.00 | 0.00 | 2.00 | 10.00 |
| 2019 | Tier 2 | 4.00 | 0.00 | 5.00 | 1.00 | 21.00 | 0.00 | 11.00 | 42.00 |
| 2020 | Tier 1 | 0.00 | 0.00 | 1.00 | 2.00 | 2.00 | 0.00 | 2.00 | 7.00 |
| 2020 | Tier 2 | 0.00 | 5.00 | 4.00 | 2.00 | 11.00 | 0.00 | 10.00 | 32.00 |
| 2021 | Tier 1 | 0.00 | 0.00 | 1.00 | 0.00 | 1.00 | 1.00 | 3.00 | 6.00 |
| 2021 | Tier 2 | 0.00 | 2.00 | 2.00 | 1.00 | 6.00 | 0.00 | 26.00 | 37.00 |
| 2022 | Tier 1 | 0.00 | 0.00 | 2.00 | 0.00 | 7.00 | 0.00 | 2.00 | 11.00 |
| 2022 | Tier 2 | 0.00 | 1.00 | 3.00 | 0.00 | 9.00 | 1.00 | 7.00 | 21.00 |
| 2023 | Tier 1 | 2.00 | 1.00 | 0.00 | 0.00 | 4.00 | 1.00 | 6.00 | 14.00 |
| 2023 | Tier 2 | 1.00 | 2.00 | 2.00 | 0.00 | 23.00 | 0.00 | 14.00 | 42.00 |
| 2024 | Tier 1 | 0.00 | 1.00 | 1.00 | 0.00 | 1.00 | 0.00 | 3.00 | 6.00 |
| 2024 | Tier 2 | 1.00 | 2.00 | 3.00 | 0.00 | 2.00 | 1.00 | 10.00 | 19.00 |
| Number of PSE for normalized results* | Africa | Asia/Australasia | Europe | Middle East | North America | Russia & Central Asia | South America | OVERALL | |
|---|---|---|---|---|---|---|---|---|---|
| 2015 | Tier 1 | 1.00 | 0.00 | 0.00 | 1.00 | 5.00 | 2.00 | 1.00 | 10.00 |
| 2015 | Tier 2 | 5.00 | 2.00 | 10.00 | 2.00 | 17.00 | 1.00 | 6.00 | 43.00 |
| 2016 | Tier 1 | 0.00 | 0.00 | 3.00 | 4.00 | 1.00 | 0.00 | 2.00 | 10.00 |
| 2016 | Tier 2 | 1.00 | 2.00 | 8.00 | 3.00 | 13.00 | 1.00 | 2.00 | 30.00 |
| 2017 | Tier 1 | 2.00 | 0.00 | 3.00 | 2.00 | 4.00 | 0.00 | 5.00 | 16.00 |
| 2017 | Tier 2 | 1.00 | 2.00 | 13.00 | 1.00 | 15.00 | 2.00 | 16.00 | 50.00 |
| 2018 | Tier 1 | 3.00 | 0.00 | 2.00 | 0.00 | 2.00 | 0.00 | 4.00 | 11.00 |
| 2018 | Tier 2 | 2.00 | 4.00 | 7.00 | 1.00 | 9.00 | 1.00 | 12.00 | 36.00 |
| 2019 | Tier 1 | 1.00 | 0.00 | 0.00 | 0.00 | 6.00 | 0.00 | 2.00 | 9.00 |
| 2019 | Tier 2 | 4.00 | 0.00 | 5.00 | 1.00 | 20.00 | 0.00 | 11.00 | 41.00 |
| 2020 | Tier 1 | 0.00 | 0.00 | 0.00 | 2.00 | 2.00 | 0.00 | 2.00 | 6.00 |
| 2020 | Tier 2 | 0.00 | 1.00 | 3.00 | 2.00 | 5.00 | 0.00 | 10.00 | 21.00 |
| 2021 | Tier 1 | 0.00 | 0.00 | 1.00 | 0.00 | 1.00 | 1.00 | 3.00 | 6.00 |
| 2021 | Tier 2 | 0.00 | 2.00 | 2.00 | 1.00 | 6.00 | 0.00 | 26.00 | 37.00 |
| 2022 | Tier 1 | 0.00 | 0.00 | 2.00 | 0.00 | 1.00 | 0.00 | 2.00 | 5.00 |
| 2022 | Tier 2 | 0.00 | 1.00 | 3.00 | 0.00 | 2.00 | 1.00 | 7.00 | 14.00 |
| 2023 | Tier 1 | 2.00 | 1.00 | 0.00 | 0.00 | 3.00 | 1.00 | 6.00 | 13.00 |
| 2023 | Tier 2 | 1.00 | 2.00 | 2.00 | 0.00 | 10.00 | 0.00 | 14.00 | 29.00 |
| 2024 | Tier 1 | 0.00 | 1.00 | 1.00 | 0.00 | 1.00 | 0.00 | 3.00 | 6.00 |
| 2024 | Tier 2 | 1.00 | 2.00 | 3.00 | 0.00 | 2.00 | 1.00 | 10.00 | 19.00 |
| Number of PSE | Africa | Asia/Australasia | Europe | Middle East | North America | Russia & Central Asia | South America | OVERALL | |
|---|---|---|---|---|---|---|---|---|---|
| 2015 | Tier 1 | 28.00 | 20.00 | 15.00 | 12.00 | 146.00 | 5.00 | 16.00 | 242.00 |
| 2015 | Tier 2 | 50.00 | 53.00 | 77.00 | 67.00 | 348.00 | 80.00 | 73.00 | 748.00 |
| 2016 | Tier 1 | 19.00 | 24.00 | 16.00 | 24.00 | 82.00 | 1.00 | 16.00 | 182.00 |
| 2016 | Tier 2 | 34.00 | 239.00 | 56.00 | 71.00 | 217.00 | 20.00 | 44.00 | 681.00 |
| 2017 | Tier 1 | 30.00 | 25.00 | 10.00 | 13.00 | 68.00 | 3.00 | 27.00 | 176.00 |
| 2017 | Tier 2 | 68.00 | 79.00 | 50.00 | 40.00 | 241.00 | 9.00 | 79.00 | 566.00 |
| 2018 | Tier 1 | 23.00 | 8.00 | 13.00 | 26.00 | 98.00 | 57.00 | 18.00 | 243.00 |
| 2018 | Tier 2 | 65.00 | 52.00 | 51.00 | 73.00 | 232.00 | 10.00 | 86.00 | 569.00 |
| 2019 | Tier 1 | 14.00 | 12.00 | 12.00 | 20.00 | 90.00 | 75.00 | 28.00 | 251.00 |
| 2019 | Tier 2 | 69.00 | 34.00 | 36.00 | 41.00 | 305.00 | 116.00 | 152.00 | 753.00 |
| 2020 | Tier 1 | 23.00 | 10.00 | 10.00 | 38.00 | 74.00 | 3.00 | 19.00 | 177.00 |
| 2020 | Tier 2 | 49.00 | 43.00 | 47.00 | 81.00 | 196.00 | 6.00 | 82.00 | 504.00 |
| 2021 | Tier 1 | 24.00 | 6.00 | 8.00 | 12.00 | 91.00 | 6.00 | 40.00 | 187.00 |
| 2021 | Tier 2 | 50.00 | 39.00 | 47.00 | 51.00 | 280.00 | 22.00 | 96.00 | 585.00 |
| 2022 | Tier 1 | 20.00 | 9.00 | 19.00 | 1.00 | 77.00 | 2.00 | 43.00 | 171.00 |
| 2022 | Tier 2 | 34.00 | 33.00 | 22.00 | 12.00 | 296.00 | 11.00 | 134.00 | 542.00 |
| 2023 | Tier 1 | 11.00 | 7.00 | 10.00 | 21.00 | 84.00 | 1.00 | 70.00 | 204.00 |
| 2023 | Tier 2 | 30.00 | 18.00 | 19.00 | 50.00 | 276.00 | 19.00 | 166.00 | 578.00 |
| 2024 | Tier 1 | 11.00 | 11.00 | 12.00 | 14.00 | 87.00 | 8.00 | 39.00 | 182.00 |
| 2024 | Tier 2 | 21.00 | 32.00 | 38.00 | 110.00 | 298.00 | 74.00 | 133.00 | 706.00 |
| Number of PSE for normalized results* | Africa | Asia/Australasia | Europe | Middle East | North America | Russia & Central Asia | South America | OVERALL | |
|---|---|---|---|---|---|---|---|---|---|
| 2015 | Tier 1 | 27.00 | 20.00 | 15.00 | 12.00 | 111.00 | 5.00 | 16.00 | 206.00 |
| 2015 | Tier 2 | 50.00 | 47.00 | 75.00 | 67.00 | 266.00 | 80.00 | 72.00 | 657.00 |
| 2016 | Tier 1 | 19.00 | 22.00 | 16.00 | 23.00 | 69.00 | 1.00 | 16.00 | 166.00 |
| 2016 | Tier 2 | 34.00 | 40.00 | 55.00 | 39.00 | 193.00 | 9.00 | 44.00 | 414.00 |
| 2017 | Tier 1 | 30.00 | 25.00 | 9.00 | 13.00 | 64.00 | 3.00 | 27.00 | 171.00 |
| 2017 | Tier 2 | 68.00 | 73.00 | 48.00 | 40.00 | 193.00 | 7.00 | 79.00 | 508.00 |
| 2018 | Tier 1 | 23.00 | 7.00 | 13.00 | 26.00 | 83.00 | 57.00 | 18.00 | 227.00 |
| 2018 | Tier 2 | 63.00 | 44.00 | 51.00 | 73.00 | 195.00 | 8.00 | 85.00 | 519.00 |
| 2019 | Tier 1 | 13.00 | 10.00 | 12.00 | 20.00 | 79.00 | 75.00 | 28.00 | 237.00 |
| 2019 | Tier 2 | 67.00 | 30.00 | 36.00 | 41.00 | 252.00 | 111.00 | 151.00 | 688.00 |
| 2020 | Tier 1 | 23.00 | 10.00 | 10.00 | 38.00 | 66.00 | 1.00 | 19.00 | 167.00 |
| 2020 | Tier 2 | 49.00 | 43.00 | 46.00 | 81.00 | 158.00 | 6.00 | 82.00 | 465.00 |
| 2021 | Tier 1 | 24.00 | 6.00 | 8.00 | 12.00 | 91.00 | 6.00 | 40.00 | 187.00 |
| 2021 | Tier 2 | 43.00 | 38.00 | 47.00 | 51.00 | 280.00 | 22.00 | 96.00 | 577.00 |
| 2022 | Tier 1 | 20.00 | 9.00 | 19.00 | 1.00 | 77.00 | 2.00 | 43.00 | 171.00 |
| 2022 | Tier 2 | 34.00 | 33.00 | 22.00 | 12.00 | 296.00 | 11.00 | 134.00 | 542.00 |
| 2023 | Tier 1 | 11.00 | 7.00 | 10.00 | 21.00 | 84.00 | 1.00 | 70.00 | 204.00 |
| 2023 | Tier 2 | 30.00 | 18.00 | 19.00 | 50.00 | 276.00 | 19.00 | 166.00 | 578.00 |
| 2024 | Tier 1 | 11.00 | 11.00 | 12.00 | 11.00 | 87.00 | 8.00 | 39.00 | 179.00 |
| 2024 | Tier 2 | 21.00 | 30.00 | 38.00 | 28.00 | 298.00 | 74.00 | 130.00 | 619.00 |
See Tables B.31 – B.40 (Number of PSE used in normalized analysis – by region and function).
| Region | Function | Tier 1 | Tier 2 | ||||
|---|---|---|---|---|---|---|---|
| Onshore | Offshore | OVERALL | Onshore | Offshore | OVERALL | ||
| Africa | Drilling | 0 | 1 | 1 | 0 | 5 | 5 |
| Africa | Production | 16 | 11 | 27 | 24 | 26 | 50 |
| Africa | OVERALL | 16 | 12 | 28 | 24 | 31 | 55 |
| Asia / Australasia | Drilling | 0 | 0 | 0 | 1 | 1 | 2 |
| Asia / Australasia | Production | 18 | 2 | 20 | 29 | 18 | 47 |
| Asia / Australasia | OVERALL | 18 | 2 | 20 | 30 | 19 | 49 |
| Europe | Drilling | 0 | 0 | 0 | 0 | 10 | 10 |
| Europe | Production | 5 | 10 | 15 | 21 | 54 | 75 |
| Europe | OVERALL | 5 | 10 | 15 | 21 | 64 | 85 |
| Middle East | Drilling | 1 | 0 | 1 | 2 | 0 | 2 |
| Middle East | Production | 10 | 2 | 12 | 59 | 8 | 67 |
| Middle East | OVERALL | 11 | 2 | 13 | 61 | 8 | 69 |
| North America | Drilling | 3 | 2 | 5 | 12 | 5 | 17 |
| North America | Production | 107 | 4 | 111 | 247 | 19 | 266 |
| North America | OVERALL | 110 | 6 | 116 | 259 | 24 | 283 |
| Russia & Central Asia | Drilling | 2 | 0 | 2 | 1 | 0 | 1 |
| Russia & Central Asia | Production | 5 | 0 | 5 | 77 | 3 | 80 |
| Russia & Central Asia | OVERALL | 7 | 0 | 7 | 78 | 3 | 81 |
| South & Central America | Drilling | 1 | 0 | 1 | 5 | 1 | 6 |
| South & Central America | Production | 15 | 1 | 16 | 62 | 10 | 72 |
| South & Central America | OVERALL | 16 | 1 | 17 | 67 | 11 | 78 |
| OVERALL | Drilling | 7 | 3 | 10 | 21 | 22 | 43 |
| OVERALL | Production | 176 | 30 | 206 | 519 | 138 | 657 |
| OVERALL | OVERALL | 183 | 33 | 216 | 540 | 160 | 700 |
| Region | Function | Tier 1 | Tier 2 | ||||
|---|---|---|---|---|---|---|---|
| Onshore | Offshore | OVERALL | Onshore | Offshore | OVERALL | ||
| Africa | Drilling | 0 | 0 | 0 | 0 | 1 | 1 |
| Africa | Production | 14 | 5 | 19 | 19 | 15 | 34 |
| Africa | OVERALL | 14 | 5 | 19 | 19 | 16 | 35 |
| Asia / Australasia | Drilling | 0 | 0 | 0 | 1 | 1 | 2 |
| Asia / Australasia | Production | 17 | 5 | 22 | 23 | 17 | 40 |
| Asia / Australasia | OVERALL | 17 | 5 | 22 | 24 | 18 | 42 |
| Europe | Drilling | 0 | 3 | 3 | 0 | 8 | 8 |
| Europe | Production | 4 | 12 | 16 | 11 | 44 | 55 |
| Europe | OVERALL | 4 | 15 | 19 | 11 | 52 | 63 |
| Middle East | Drilling | 4 | 0 | 4 | 2 | 1 | 3 |
| Middle East | Production | 20 | 3 | 23 | 36 | 3 | 39 |
| Middle East | OVERALL | 24 | 3 | 27 | 38 | 4 | 42 |
| North America | Drilling | 1 | 0 | 1 | 8 | 5 | 13 |
| North America | Production | 65 | 4 | 69 | 181 | 12 | 193 |
| North America | OVERALL | 66 | 4 | 70 | 189 | 17 | 206 |
| Russia & Central Asia | Drilling | 0 | 0 | 0 | 0 | 1 | 1 |
| Russia & Central Asia | Production | 1 | 0 | 1 | 8 | 1 | 9 |
| Russia & Central Asia | OVERALL | 1 | 0 | 1 | 8 | 2 | 10 |
| South & Central America | Drilling | 2 | 0 | 2 | 2 | 0 | 2 |
| South & Central America | Production | 12 | 4 | 16 | 36 | 8 | 44 |
| South & Central America | OVERALL | 14 | 4 | 18 | 38 | 8 | 46 |
| OVERALL | Drilling | 7 | 3 | 10 | 13 | 17 | 30 |
| OVERALL | Production | 133 | 33 | 166 | 314 | 100 | 414 |
| OVERALL | OVERALL | 140 | 36 | 176 | 327 | 117 | 444 |
| Region | Function | Tier 1 | Tier 2 | ||||
|---|---|---|---|---|---|---|---|
| Onshore | Offshore | OVERALL | Onshore | Offshore | OVERALL | ||
| Africa | Drilling | 0 | 2 | 2 | 1 | 0 | 1 |
| Africa | Production | 20 | 10 | 30 | 49 | 19 | 68 |
| Africa | OVERALL | 20 | 12 | 32 | 50 | 19 | 69 |
| Asia / Australasia | Drilling | 0 | 0 | 0 | 1 | 1 | 2 |
| Asia / Australasia | Production | 15 | 10 | 25 | 22 | 51 | 73 |
| Asia / Australasia | OVERALL | 15 | 10 | 25 | 23 | 52 | 75 |
| Europe | Drilling | 0 | 3 | 3 | 0 | 13 | 13 |
| Europe | Production | 4 | 5 | 9 | 19 | 29 | 48 |
| Europe | OVERALL | 4 | 8 | 12 | 19 | 42 | 61 |
| Middle East | Drilling | 2 | 0 | 2 | 1 | 0 | 1 |
| Middle East | Production | 10 | 3 | 13 | 34 | 6 | 40 |
| Middle East | OVERALL | 12 | 3 | 15 | 35 | 6 | 41 |
| North America | Drilling | 4 | 0 | 4 | 12 | 3 | 15 |
| North America | Production | 63 | 1 | 64 | 183 | 10 | 193 |
| North America | OVERALL | 67 | 1 | 68 | 195 | 13 | 208 |
| Russia & Central Asia | Drilling | 0 | 0 | 0 | 1 | 1 | 2 |
| Russia & Central Asia | Production | 3 | 0 | 3 | 5 | 2 | 7 |
| Russia & Central Asia | OVERALL | 3 | 0 | 3 | 6 | 3 | 9 |
| South & Central America | Drilling | 2 | 3 | 5 | 4 | 12 | 16 |
| South & Central America | Production | 16 | 11 | 27 | 44 | 35 | 79 |
| South & Central America | OVERALL | 18 | 14 | 32 | 48 | 47 | 95 |
| OVERALL | Drilling | 8 | 8 | 16 | 20 | 30 | 50 |
| OVERALL | Production | 131 | 40 | 171 | 356 | 152 | 508 |
| OVERALL | OVERALL | 139 | 48 | 187 | 376 | 182 | 558 |
| Region | Function | Tier 1 | Tier 2 | ||||
|---|---|---|---|---|---|---|---|
| Onshore | Offshore | OVERALL | Onshore | Offshore | OVERALL | ||
| Africa | Drilling | 2 | 1 | 3 | 1 | 1 | 2 |
| Africa | Production | 18 | 5 | 23 | 37 | 26 | 63 |
| Africa | OVERALL | 20 | 6 | 26 | 38 | 27 | 65 |
| Asia / Australasia | Drilling | 0 | 0 | 0 | 1 | 3 | 4 |
| Asia / Australasia | Production | 1 | 6 | 7 | 18 | 26 | 44 |
| Asia / Australasia | OVERALL | 1 | 6 | 7 | 19 | 29 | 48 |
| Europe | Drilling | 1 | 1 | 2 | 0 | 7 | 7 |
| Europe | Production | 8 | 5 | 13 | 18 | 33 | 51 |
| Europe | OVERALL | 9 | 6 | 15 | 18 | 40 | 58 |
| Middle East | Drilling | 0 | 0 | 0 | 1 | 0 | 1 |
| Middle East | Production | 24 | 2 | 26 | 71 | 2 | 73 |
| Middle East | OVERALL | 24 | 2 | 26 | 72 | 2 | 74 |
| North America | Drilling | 2 | 0 | 2 | 9 | 0 | 9 |
| North America | Production | 79 | 4 | 83 | 184 | 11 | 195 |
| North America | OVERALL | 81 | 4 | 85 | 193 | 11 | 204 |
| Russia & Central Asia | Drilling | 0 | 0 | 0 | 0 | 1 | 1 |
| Russia & Central Asia | Production | 57 | 0 | 57 | 8 | 0 | 8 |
| Russia & Central Asia | OVERALL | 57 | 0 | 57 | 8 | 1 | 9 |
| South & Central America | Drilling | 4 | 0 | 4 | 9 | 3 | 12 |
| South & Central America | Production | 12 | 6 | 18 | 44 | 41 | 85 |
| South & Central America | OVERALL | 16 | 6 | 22 | 53 | 44 | 97 |
| OVERALL | Drilling | 9 | 2 | 11 | 21 | 15 | 36 |
| OVERALL | Production | 199 | 28 | 227 | 380 | 139 | 519 |
| OVERALL | OVERALL | 208 | 30 | 238 | 401 | 154 | 555 |
| Region | Function | Tier 1 | Tier 2 | ||||
|---|---|---|---|---|---|---|---|
| Onshore | Offshore | OVERALL | Onshore | Offshore | OVERALL | ||
| Africa | Drilling | 1 | 0 | 1 | 2 | 2 | 4 |
| Africa | Production | 4 | 9 | 13 | 46 | 21 | 67 |
| Africa | OVERALL | 5 | 9 | 14 | 48 | 23 | 71 |
| Asia / Australasia | Drilling | 0 | 0 | 0 | 0 | 0 | 0 |
| Asia / Australasia | Production | 4 | 6 | 10 | 12 | 18 | 30 |
| Asia / Australasia | OVERALL | 4 | 6 | 10 | 12 | 18 | 30 |
| Europe | Drilling | 0 | 0 | 0 | 0 | 5 | 5 |
| Europe | Production | 5 | 7 | 12 | 14 | 22 | 36 |
| Europe | OVERALL | 5 | 7 | 12 | 14 | 27 | 41 |
| Middle East | Drilling | 0 | 0 | 0 | 1 | 0 | 1 |
| Middle East | Production | 19 | 1 | 20 | 37 | 4 | 41 |
| Middle East | OVERALL | 19 | 1 | 20 | 38 | 4 | 42 |
| North America | Drilling | 5 | 1 | 6 | 19 | 1 | 20 |
| North America | Production | 78 | 1 | 79 | 243 | 9 | 252 |
| North America | OVERALL | 83 | 2 | 85 | 262 | 10 | 272 |
| Russia & Central Asia | Drilling | 0 | 0 | 0 | 0 | 0 | 0 |
| Russia & Central Asia | Production | 75 | 0 | 75 | 109 | 2 | 111 |
| Russia & Central Asia | OVERALL | 75 | 0 | 75 | 109 | 2 | 111 |
| South & Central America | Drilling | 2 | 0 | 2 | 7 | 4 | 11 |
| South & Central America | Production | 16 | 12 | 28 | 111 | 40 | 151 |
| South & Central America | OVERALL | 18 | 12 | 30 | 118 | 44 | 162 |
| OVERALL | Drilling | 8 | 1 | 9 | 29 | 12 | 41 |
| OVERALL | Production | 201 | 36 | 237 | 572 | 116 | 688 |
| OVERALL | OVERALL | 209 | 37 | 246 | 601 | 128 | 729 |
| Region | Function | Tier 1 | Tier 2 | ||||
|---|---|---|---|---|---|---|---|
| Onshore | Offshore | OVERALL | Onshore | Offshore | OVERALL | ||
| Africa | Drilling | 0 | 0 | 0 | 0 | 0 | 0 |
| Africa | Production | 13 | 10 | 23 | 32 | 17 | 49 |
| Africa | OVERALL | 13 | 10 | 23 | 32 | 17 | 49 |
| Asia / Australasia | Drilling | 0 | 0 | 0 | 0 | 1 | 1 |
| Asia / Australasia | Production | 7 | 3 | 10 | 17 | 26 | 43 |
| Asia / Australasia | OVERALL | 7 | 3 | 10 | 17 | 27 | 44 |
| Europe | Drilling | 0 | 0 | 0 | 0 | 3 | 3 |
| Europe | Production | 7 | 3 | 10 | 28 | 18 | 46 |
| Europe | OVERALL | 7 | 3 | 10 | 28 | 21 | 49 |
| Middle East | Drilling | 2 | 0 | 2 | 2 | 0 | 2 |
| Middle East | Production | 38 | 0 | 38 | 76 | 5 | 81 |
| Middle East | OVERALL | 40 | 0 | 40 | 78 | 5 | 83 |
| North America | Drilling | 2 | 0 | 2 | 4 | 1 | 5 |
| North America | Production | 64 | 2 | 66 | 153 | 5 | 158 |
| North America | OVERALL | 66 | 2 | 68 | 157 | 6 | 163 |
| Russia & Central Asia | Drilling | 0 | 0 | 0 | 0 | 0 | 0 |
| Russia & Central Asia | Production | 1 | 0 | 1 | 3 | 3 | 6 |
| Russia & Central Asia | OVERALL | 1 | 0 | 1 | 3 | 3 | 6 |
| South & Central America | Drilling | 1 | 1 | 2 | 4 | 6 | 10 |
| South & Central America | Production | 12 | 7 | 19 | 51 | 31 | 82 |
| South & Central America | OVERALL | 13 | 8 | 21 | 55 | 37 | 92 |
| OVERALL | Drilling | 5 | 1 | 6 | 10 | 11 | 21 |
| OVERALL | Production | 142 | 25 | 167 | 360 | 105 | 465 |
| OVERALL | OVERALL | 147 | 26 | 173 | 370 | 116 | 486 |
| Region | Function | Tier 1 | Tier 2 | ||||
|---|---|---|---|---|---|---|---|
| Onshore | Offshore | OVERALL | Onshore | Offshore | OVERALL | ||
| Africa | Drilling | 0 | 0 | 0 | 0 | 0 | 0 |
| Africa | Production | 17 | 7 | 24 | 30 | 13 | 43 |
| Africa | OVERALL | 17 | 7 | 24 | 30 | 13 | 43 |
| Asia / Australasia | Drilling | 0 | 0 | 0 | 0 | 2 | 2 |
| Asia / Australasia | Production | 5 | 1 | 6 | 19 | 19 | 38 |
| Asia / Australasia | OVERALL | 5 | 1 | 6 | 19 | 21 | 40 |
| Europe | Drilling | 1 | 0 | 1 | 0 | 2 | 2 |
| Europe | Production | 4 | 4 | 8 | 22 | 25 | 47 |
| Europe | OVERALL | 5 | 4 | 9 | 22 | 27 | 49 |
| Middle East | Drilling | 0 | 0 | 0 | 1 | 0 | 1 |
| Middle East | Production | 12 | 0 | 12 | 50 | 1 | 51 |
| Middle East | OVERALL | 12 | 0 | 12 | 51 | 1 | 52 |
| North America | Drilling | 1 | 0 | 1 | 5 | 1 | 6 |
| North America | Production | 87 | 4 | 91 | 273 | 7 | 280 |
| North America | OVERALL | 88 | 4 | 92 | 278 | 8 | 286 |
| Russia & Central Asia | Drilling | 1 | 0 | 1 | 0 | 0 | 0 |
| Russia & Central Asia | Production | 6 | 0 | 6 | 19 | 3 | 22 |
| Russia & Central Asia | OVERALL | 7 | 0 | 7 | 19 | 3 | 22 |
| South & Central America | Drilling | 3 | 0 | 3 | 25 | 1 | 26 |
| South & Central America | Production | 35 | 5 | 40 | 77 | 19 | 96 |
| South & Central America | OVERALL | 38 | 5 | 43 | 102 | 20 | 122 |
| OVERALL | Drilling | 6 | 0 | 6 | 31 | 6 | 37 |
| OVERALL | Production | 166 | 21 | 187 | 490 | 87 | 577 |
| OVERALL | OVERALL | 172 | 21 | 193 | 521 | 93 | 614 |
| Region | Function | Tier 1 | Tier 2 | ||||
|---|---|---|---|---|---|---|---|
| Onshore | Offshore | OVERALL | Onshore | Offshore | OVERALL | ||
| Africa | Drilling | 0 | 0 | 0 | 0 | 0 | 0 |
| Africa | Production | 14 | 6 | 20 | 21 | 13 | 34 |
| Africa | OVERALL | 14 | 6 | 20 | 21 | 13 | 34 |
| Asia / Australasia | Drilling | 0 | 0 | 0 | 0 | 1 | 1 |
| Asia / Australasia | Production | 6 | 3 | 9 | 19 | 14 | 33 |
| Asia / Australasia | OVERALL | 6 | 3 | 9 | 19 | 15 | 34 |
| Europe | Drilling | 0 | 2 | 2 | 0 | 3 | 3 |
| Europe | Production | 6 | 13 | 19 | 12 | 10 | 22 |
| Europe | OVERALL | 6 | 15 | 21 | 12 | 13 | 25 |
| Middle East | Drilling | 0 | 0 | 0 | 0 | 0 | 0 |
| Middle East | Production | 1 | 0 | 1 | 6 | 6 | 12 |
| Middle East | OVERALL | 1 | 0 | 1 | 6 | 6 | 12 |
| North America | Drilling | 1 | 0 | 1 | 2 | 0 | 2 |
| North America | Production | 77 | 0 | 77 | 293 | 3 | 296 |
| North America | OVERALL | 78 | 0 | 78 | 295 | 3 | 298 |
| Russia & Central Asia | Drilling | 0 | 0 | 0 | 0 | 1 | 1 |
| Russia & Central Asia | Production | 1 | 1 | 2 | 6 | 5 | 11 |
| Russia & Central Asia | OVERALL | 1 | 1 | 2 | 6 | 6 | 12 |
| South & Central America | Drilling | 2 | 0 | 2 | 7 | 0 | 7 |
| South & Central America | Production | 34 | 9 | 43 | 112 | 22 | 134 |
| South & Central America | OVERALL | 36 | 9 | 45 | 119 | 22 | 141 |
| OVERALL | Drilling | 3 | 2 | 5 | 9 | 5 | 14 |
| OVERALL | Production | 139 | 32 | 171 | 469 | 73 | 542 |
| OVERALL | OVERALL | 142 | 34 | 176 | 478 | 78 | 556 |
| Region | Function | Tier 1 | Tier 2 | ||||
|---|---|---|---|---|---|---|---|
| Onshore | Offshore | OVERALL | Onshore | Offshore | OVERALL | ||
| Africa | Drilling | 1 | 1 | 2 | 0 | 1 | 1 |
| Africa | Production | 2 | 9 | 11 | 10 | 20 | 30 |
| Africa | OVERALL | 3 | 10 | 13 | 10 | 21 | 31 |
| Asia / Australasia | Drilling | 0 | 1 | 1 | 0 | 2 | 2 |
| Asia / Australasia | Production | 3 | 4 | 7 | 10 | 8 | 18 |
| Asia / Australasia | OVERALL | 3 | 5 | 8 | 10 | 10 | 20 |
| Europe | Drilling | 0 | 0 | 0 | 1 | 1 | 2 |
| Europe | Production | 7 | 3 | 10 | 11 | 8 | 19 |
| Europe | OVERALL | 7 | 3 | 10 | 12 | 9 | 21 |
| Middle East | Drilling | 0 | 0 | 0 | 0 | 0 | 0 |
| Middle East | Production | 14 | 7 | 21 | 45 | 5 | 50 |
| Middle East | OVERALL | 14 | 7 | 21 | 45 | 5 | 50 |
| North America | Drilling | 3 | 0 | 3 | 9 | 1 | 10 |
| North America | Production | 83 | 1 | 84 | 269 | 7 | 276 |
| North America | OVERALL | 86 | 1 | 87 | 278 | 8 | 286 |
| Russia & Central Asia | Drilling | 1 | 0 | 1 | 0 | 0 | 0 |
| Russia & Central Asia | Production | 1 | 0 | 1 | 13 | 6 | 19 |
| Russia & Central Asia | OVERALL | 2 | 0 | 2 | 13 | 6 | 19 |
| South & Central America | Drilling | 5 | 1 | 6 | 10 | 4 | 14 |
| South & Central America | Production | 50 | 20 | 70 | 139 | 27 | 166 |
| South & Central America | OVERALL | 55 | 21 | 76 | 149 | 31 | 180 |
| OVERALL | Drilling | 10 | 3 | 13 | 20 | 9 | 29 |
| OVERALL | Production | 160 | 44 | 204 | 497 | 81 | 578 |
| OVERALL | OVERALL | 170 | 47 | 217 | 517 | 90 | 607 |
| Region | Function | Tier 1 | Tier 2 | ||||
|---|---|---|---|---|---|---|---|
| Onshore | Offshore | OVERALL | Onshore | Offshore | OVERALL | ||
| Africa | Drilling | 0 | 0 | 0 | 1 | 0 | 1 |
| Africa | Production | 5 | 6 | 11 | 12 | 9 | 21 |
| Africa | OVERALL | 5 | 6 | 11 | 13 | 9 | 22 |
| Asia / Australasia | Drilling | 1 | 0 | 1 | 0 | 2 | 2 |
| Asia / Australasia | Production | 7 | 4 | 11 | 17 | 13 | 30 |
| Asia / Australasia | OVERALL | 8 | 4 | 12 | 17 | 15 | 32 |
| Europe | Drilling | 0 | 1 | 1 | 0 | 3 | 3 |
| Europe | Production | 6 | 6 | 12 | 19 | 19 | 38 |
| Europe | OVERALL | 6 | 7 | 13 | 19 | 22 | 41 |
| Middle East | Drilling | 0 | 0 | 0 | 0 | 0 | 0 |
| Middle East | Production | 10 | 1 | 11 | 25 | 3 | 28 |
| Middle East | OVERALL | 10 | 1 | 11 | 25 | 3 | 28 |
| North America | Drilling | 1 | 0 | 1 | 2 | 0 | 2 |
| North America | Production | 87 | 0 | 87 | 295 | 3 | 298 |
| North America | OVERALL | 88 | 0 | 88 | 297 | 3 | 300 |
| Russia & Central Asia | Drilling | 0 | 0 | 0 | 1 | 0 | 1 |
| Russia & Central Asia | Production | 7 | 1 | 8 | 53 | 21 | 74 |
| Russia & Central Asia | OVERALL | 7 | 1 | 8 | 54 | 21 | 75 |
| South & Central America | Drilling | 2 | 1 | 3 | 8 | 2 | 10 |
| South & Central America | Production | 28 | 11 | 39 | 90 | 40 | 130 |
| South & Central America | OVERALL | 30 | 12 | 42 | 98 | 42 | 140 |
| OVERALL | Drilling | 4 | 2 | 6 | 12 | 7 | 19 |
| OVERALL | Production | 150 | 29 | 179 | 511 | 108 | 619 |
| OVERALL | OVERALL | 154 | 31 | 185 | 523 | 115 | 638 |
Tables B.41–50 show the number of work hours in the main safety database for which there were related PSE data (even if zero), i.e., those that were included in the calculation of PSE per million work hours in this report.
| Region | Function | Tier 1 | Tier 2 | ||||
|---|---|---|---|---|---|---|---|
| Onshore | Offshore | OVERALL | Onshore | Offshore | OVERALL | ||
| Africa | Drilling | 18,780 | 31,711 | 50,491 | 18,780 | 31,711 | 50,491 |
| Africa | Production | 109,242 | 33,594 | 142,836 | 109,242 | 33,594 | 142,836 |
| Africa | OVERALL | 128,022 | 65,305 | 193,327 | 128,022 | 65,305 | 193,327 |
| Asia / Australasia | Drilling | 44,874 | 42,865 | 87,739 | 42,531 | 24,921 | 67,452 |
| Asia / Australasia | Production | 118,825 | 99,533 | 218,358 | 114,429 | 53,488 | 167,917 |
| Asia / Australasia | OVERALL | 163,699 | 142,398 | 306,097 | 156,960 | 78,409 | 235,369 |
| Europe | Drilling | 19,917 | 26,266 | 46,183 | 21,469 | 26,412 | 47,881 |
| Europe | Production | 66,642 | 71,960 | 138,602 | 66,642 | 71,960 | 138,602 |
| Europe | OVERALL | 86,559 | 98,226 | 184,785 | 88,111 | 98,372 | 186,483 |
| Middle East | Drilling | 54,175 | 12,622 | 66,797 | 54,175 | 10,779 | 64,954 |
| Middle East | Production | 145,474 | 28,417 | 173,891 | 145,608 | 28,417 | 174,025 |
| Middle East | OVERALL | 199,649 | 41,039 | 240,688 | 199,783 | 39,196 | 238,979 |
| North America | Drilling | 73,584 | 33,642 | 107,226 | 117,399 | 67,615 | 185,014 |
| North America | Production | 145,555 | 141,004 | 286,559 | 204,134 | 140,663 | 344,797 |
| North America | OVERALL | 219,139 | 174,646 | 393,785 | 321,533 | 208,278 | 529,811 |
| Russia & Central Asia | Drilling | 23,988 | 7,145 | 31,133 | 23,988 | 7,145 | 31,133 |
| Russia & Central Asia | Production | 70,413 | 18,825 | 89,238 | 70,413 | 18,825 | 89,238 |
| Russia & Central Asia | OVERALL | 94,401 | 25,970 | 120,371 | 94,401 | 25,970 | 120,371 |
| South & Central America | Drilling | 22,955 | 5,623 | 28,578 | 22,955 | 5,623 | 28,578 |
| South & Central America | Production | 45,317 | 9,474 | 54,791 | 45,317 | 9,474 | 54,791 |
| South & Central America | OVERALL | 68,272 | 15,097 | 83,369 | 68,272 | 15,097 | 83,369 |
| OVERALL | Drilling | 258,273 | 159,874 | 418,147 | 301,297 | 174,206 | 475,503 |
| OVERALL | Production | 701,468 | 402,807 | 1,104,275 | 755,785 | 356,421 | 1,112,206 |
| OVERALL | OVERALL | 959,741 | 562,681 | 1,522,422 | 1,057,082 | 530,627 | 1,587,709 |
| Region | Function | Tier 1 | Tier 2 | ||||
|---|---|---|---|---|---|---|---|
| Onshore | Offshore | OVERALL | Onshore | Offshore | OVERALL | ||
| Africa | Drilling | 16,489 | 21,349 | 37,838 | 16,489 | 21,349 | 37,838 |
| Africa | Production | 83,611 | 34,104 | 117,715 | 83,611 | 34,104 | 117,715 |
| Africa | OVERALL | 100,100 | 55,453 | 155,553 | 100,100 | 55,453 | 155,553 |
| Asia / Australasia | Drilling | 31,508 | 37,445 | 68,953 | 27,472 | 18,583 | 46,055 |
| Asia / Australasia | Production | 99,237 | 103,362 | 202,599 | 86,801 | 57,494 | 144,295 |
| Asia / Australasia | OVERALL | 130,745 | 140,807 | 271,552 | 114,273 | 76,077 | 190,350 |
| Europe | Drilling | 13,206 | 20,801 | 34,007 | 13,206 | 20,801 | 34,007 |
| Europe | Production | 58,998 | 59,315 | 118,313 | 58,998 | 59,315 | 118,313 |
| Europe | OVERALL | 72,204 | 80,116 | 152,320 | 72,204 | 80,116 | 152,320 |
| Middle East | Drilling | 71,527 | 17,531 | 89,058 | 71,527 | 17,531 | 89,058 |
| Middle East | Production | 119,679 | 9,400 | 129,079 | 119,679 | 9,400 | 129,079 |
| Middle East | OVERALL | 191,206 | 26,931 | 218,137 | 191,206 | 26,931 | 218,137 |
| North America | Drilling | 24,063 | 19,688 | 43,751 | 24,063 | 19,688 | 43,751 |
| North America | Production | 101,712 | 20,220 | 121,932 | 101,712 | 20,220 | 121,932 |
| North America | OVERALL | 125,775 | 39,908 | 165,683 | 125,775 | 39,908 | 165,683 |
| Russia & Central Asia | Drilling | 5,883 | 5,996 | 11,879 | 5,883 | 5,996 | 11,879 |
| Russia & Central Asia | Production | 41,264 | 18,111 | 59,375 | 41,264 | 18,111 | 59,375 |
| Russia & Central Asia | OVERALL | 47,147 | 24,107 | 71,254 | 47,147 | 24,107 | 71,254 |
| South & Central America | Drilling | 13,893 | 4,624 | 18,517 | 13,346 | 4,624 | 17,970 |
| South & Central America | Production | 34,458 | 8,879 | 43,337 | 34,458 | 8,879 | 43,337 |
| South & Central America | OVERALL | 48,351 | 13,503 | 61,854 | 47,804 | 13,503 | 61,307 |
| OVERALL | Drilling | 176,569 | 127,434 | 304,003 | 171,986 | 108,572 | 280,558 |
| OVERALL | Production | 538,959 | 253,391 | 792,350 | 526,523 | 207,523 | 734,046 |
| OVERALL | OVERALL | 715,528 | 380,825 | 1,096,353 | 698,509 | 316,095 | 1,014,604 |
| Region | Function | Tier 1 | Tier 2 | ||||
|---|---|---|---|---|---|---|---|
| Onshore | Offshore | OVERALL | Onshore | Offshore | OVERALL | ||
| Africa | Drilling | 22,924 | 21,547 | 44,471 | 22,924 | 21,547 | 44,471 |
| Africa | Production | 139,683 | 33,611 | 173,294 | 139,683 | 33,611 | 173,294 |
| Africa | OVERALL | 162,607 | 55,158 | 217,765 | 162,607 | 55,158 | 217,765 |
| Asia / Australasia | Drilling | 23,307 | 15,574 | 38,881 | 23,228 | 14,946 | 38,174 |
| Asia / Australasia | Production | 83,064 | 75,691 | 158,755 | 83,011 | 74,100 | 157,111 |
| Asia / Australasia | OVERALL | 106,371 | 91,265 | 197,636 | 106,239 | 89,046 | 195,285 |
| Europe | Drilling | 16,110 | 17,169 | 33,279 | 16,110 | 17,169 | 33,279 |
| Europe | Production | 50,698 | 58,337 | 109,035 | 50,698 | 58,337 | 109,035 |
| Europe | OVERALL | 66,808 | 75,506 | 142,314 | 66,808 | 75,506 | 142,314 |
| Middle East | Drilling | 67,094 | 25,246 | 92,340 | 65,267 | 25,246 | 90,513 |
| Middle East | Production | 191,880 | 53,688 | 245,568 | 189,982 | 53,688 | 243,670 |
| Middle East | OVERALL | 258,974 | 78,934 | 337,908 | 255,249 | 78,934 | 334,183 |
| North America | Drilling | 44,137 | 17,320 | 61,457 | 44,137 | 17,320 | 61,457 |
| North America | Production | 100,009 | 17,951 | 117,960 | 100,009 | 17,951 | 117,960 |
| North America | OVERALL | 144,146 | 35,271 | 179,417 | 144,146 | 35,271 | 179,417 |
| Russia & Central Asia | Drilling | 12,941 | 9,562 | 22,503 | 12,941 | 9,562 | 22,503 |
| Russia & Central Asia | Production | 75,104 | 18,741 | 93,845 | 75,104 | 18,741 | 93,845 |
| Russia & Central Asia | OVERALL | 88,045 | 28,303 | 116,348 | 88,045 | 28,303 | 116,348 |
| South & Central America | Drilling | 27,247 | 21,013 | 48,260 | 27,247 | 21,013 | 48,260 |
| South & Central America | Production | 113,126 | 96,763 | 209,889 | 113,126 | 96,763 | 209,889 |
| South & Central America | OVERALL | 140,373 | 117,776 | 258,149 | 140,373 | 117,776 | 258,149 |
| OVERALL | Drilling | 213,760 | 127,431 | 341,191 | 211,854 | 126,803 | 338,657 |
| OVERALL | Production | 753,564 | 354,782 | 1,108,346 | 751,613 | 353,191 | 1,104,804 |
| OVERALL | OVERALL | 967,324 | 482,213 | 1,449,537 | 963,467 | 479,994 | 1,443,461 |
| Region | Function | Tier 1 | Tier 2 | ||||
|---|---|---|---|---|---|---|---|
| Onshore | Offshore | OVERALL | Onshore | Offshore | OVERALL | ||
| Africa | Drilling | 24,684 | 17,178 | 41,862 | 22,200 | 15,019 | 37,219 |
| Africa | Production | 162,651 | 37,935 | 200,586 | 159,654 | 37,935 | 197,589 |
| Africa | OVERALL | 187,335 | 55,113 | 242,448 | 181,854 | 52,954 | 234,808 |
| Asia / Australasia | Drilling | 12,459 | 22,266 | 34,725 | 12,459 | 21,746 | 34,205 |
| Asia / Australasia | Production | 90,993 | 82,077 | 173,070 | 90,301 | 82,077 | 172,378 |
| Asia / Australasia | OVERALL | 103,452 | 104,343 | 207,795 | 102,760 | 103,823 | 206,583 |
| Europe | Drilling | 18,481 | 16,794 | 35,275 | 17,833 | 16,131 | 33,964 |
| Europe | Production | 50,194 | 51,134 | 101,328 | 47,507 | 47,341 | 94,848 |
| Europe | OVERALL | 68,675 | 67,928 | 136,603 | 65,340 | 63,472 | 128,812 |
| Middle East | Drilling | 66,581 | 18,379 | 84,960 | 66,581 | 18,379 | 84,960 |
| Middle East | Production | 243,134 | 40,198 | 283,332 | 243,134 | 40,198 | 283,332 |
| Middle East | OVERALL | 309,715 | 58,577 | 368,292 | 309,715 | 58,577 | 368,292 |
| North America | Drilling | 39,795 | 16,825 | 56,620 | 39,795 | 16,815 | 56,610 |
| North America | Production | 104,810 | 15,871 | 120,681 | 104,810 | 14,594 | 119,404 |
| North America | OVERALL | 144,605 | 32,696 | 177,301 | 144,605 | 31,409 | 176,014 |
| Russia & Central Asia | Drilling | 9,095 | 6,663 | 15,758 | 9,095 | 6,663 | 15,758 |
| Russia & Central Asia | Production | 74,121 | 18,998 | 93,119 | 40,744 | 18,998 | 59,742 |
| Russia & Central Asia | OVERALL | 83,216 | 25,661 | 108,877 | 49,839 | 25,661 | 75,500 |
| South & Central America | Drilling | 26,041 | 22,643 | 48,684 | 24,574 | 21,709 | 46,283 |
| South & Central America | Production | 113,630 | 91,335 | 204,965 | 113,238 | 90,114 | 203,352 |
| South & Central America | OVERALL | 139,671 | 113,978 | 253,649 | 137,812 | 111,823 | 249,635 |
| OVERALL | Drilling | 197,136 | 120,748 | 317,884 | 192,537 | 116,462 | 308,999 |
| OVERALL | Production | 839,533 | 337,548 | 1,177,081 | 799,388 | 331,257 | 1,130,645 |
| OVERALL | OVERALL | 1,036,669 | 458,296 | 1,494,965 | 991,925 | 447,719 | 1,439,644 |
| Region | Function | Tier 1 | Tier 2 | ||||
|---|---|---|---|---|---|---|---|
| Onshore | Offshore | OVERALL | Onshore | Offshore | OVERALL | ||
| Africa | Drilling | 20,792 | 20,548 | 41,340 | 21,127 | 19,094 | 40,221 |
| Africa | Production | 174,420 | 47,330 | 221,750 | 176,115 | 47,330 | 223,445 |
| Africa | OVERALL | 195,212 | 67,878 | 263,090 | 197,242 | 66,424 | 263,666 |
| Asia / Australasia | Drilling | 22,114 | 42,620 | 64,734 | 22,114 | 42,772 | 64,886 |
| Asia / Australasia | Production | 118,525 | 130,944 | 249,469 | 119,533 | 130,944 | 250,477 |
| Asia / Australasia | OVERALL | 140,639 | 173,564 | 314,203 | 141,647 | 173,716 | 315,363 |
| Europe | Drilling | 19,079 | 18,479 | 37,558 | 19,026 | 18,416 | 37,442 |
| Europe | Production | 59,875 | 61,339 | 121,214 | 59,579 | 61,339 | 120,918 |
| Europe | OVERALL | 78,954 | 79,818 | 158,772 | 78,605 | 79,755 | 158,360 |
| Middle East | Drilling | 70,283 | 21,414 | 91,697 | 70,283 | 21,414 | 91,697 |
| Middle East | Production | 187,993 | 61,364 | 249,357 | 187,993 | 61,364 | 249,357 |
| Middle East | OVERALL | 258,276 | 82,778 | 341,054 | 258,276 | 82,778 | 341,054 |
| North America | Drilling | 50,100 | 20,463 | 70,563 | 50,068 | 20,463 | 70,531 |
| North America | Production | 133,103 | 15,767 | 148,870 | 133,103 | 15,767 | 148,870 |
| North America | OVERALL | 183,203 | 36,230 | 219,433 | 183,171 | 36,230 | 219,401 |
| Russia & Central Asia | Drilling | 12,325 | 5,995 | 18,320 | 12,706 | 5,995 | 18,701 |
| Russia & Central Asia | Production | 96,674 | 11,070 | 107,744 | 96,674 | 11,070 | 107,744 |
| Russia & Central Asia | OVERALL | 108,999 | 17,065 | 126,064 | 109,380 | 17,065 | 126,445 |
| South & Central America | Drilling | 33,987 | 19,593 | 53,580 | 44,328 | 19,593 | 63,921 |
| South & Central America | Production | 152,727 | 83,078 | 235,805 | 152,727 | 83,078 | 235,805 |
| South & Central America | OVERALL | 186,714 | 102,671 | 289,385 | 197,055 | 102,671 | 299,726 |
| OVERALL | Drilling | 228,680 | 149,112 | 377,792 | 239,652 | 147,747 | 387,399 |
| OVERALL | Production | 923,317 | 410,892 | 1,334,209 | 925,724 | 410,892 | 1,336,616 |
| OVERALL | OVERALL | 1,151,997 | 560,004 | 1,712,001 | 1,165,376 | 558,639 | 1,724,015 |
| Region | Function | Tier 1 | Tier 2 | ||||
|---|---|---|---|---|---|---|---|
| Onshore | Offshore | OVERALL | Onshore | Offshore | OVERALL | ||
| Africa | Drilling | 15,810 | 8,880 | 24,690 | 15,810 | 8,880 | 24,690 |
| Africa | Production | 135,737 | 32,149 | 167,886 | 135,737 | 32,149 | 167,886 |
| Africa | OVERALL | 151,547 | 41,029 | 192,576 | 151,547 | 41,029 | 192,576 |
| Asia / Australasia | Drilling | 19,938 | 40,588 | 60,526 | 19,938 | 40,588 | 60,526 |
| Asia / Australasia | Production | 138,246 | 121,868 | 260,114 | 138,246 | 121,868 | 260,114 |
| Asia / Australasia | OVERALL | 158,184 | 162,456 | 320,640 | 158,184 | 162,456 | 320,640 |
| Europe | Drilling | 15,268 | 14,751 | 30,019 | 15,268 | 14,751 | 30,019 |
| Europe | Production | 55,587 | 47,666 | 103,253 | 55,587 | 47,666 | 103,253 |
| Europe | OVERALL | 70,855 | 62,417 | 133,272 | 70,855 | 62,417 | 133,272 |
| Middle East | Drilling | 66,111 | 21,173 | 87,284 | 66,111 | 21,173 | 87,284 |
| Middle East | Production | 159,572 | 72,294 | 231,866 | 159,572 | 72,294 | 231,866 |
| Middle East | OVERALL | 225,683 | 93,467 | 319,150 | 225,683 | 93,467 | 319,150 |
| North America | Drilling | 25,876 | 15,674 | 41,550 | 25,876 | 15,674 | 41,550 |
| North America | Production | 74,799 | 10,400 | 85,199 | 74,799 | 10,400 | 85,199 |
| North America | OVERALL | 100,675 | 26,074 | 126,749 | 100,675 | 26,074 | 126,749 |
| Russia & Central Asia | Drilling | 8,183 | 4,411 | 12,594 | 8,183 | 4,411 | 12,594 |
| Russia & Central Asia | Production | 79,220 | 4,495 | 83,715 | 79,220 | 4,495 | 83,715 |
| Russia & Central Asia | OVERALL | 87,403 | 8,906 | 96,309 | 87,403 | 8,906 | 96,309 |
| South & Central America | Drilling | 28,098 | 22,435 | 50,533 | 28,098 | 22,435 | 50,533 |
| South & Central America | Production | 103,830 | 63,399 | 167,229 | 103,830 | 63,399 | 167,229 |
| South & Central America | OVERALL | 131,928 | 85,834 | 217,762 | 131,928 | 85,834 | 217,762 |
| OVERALL | Drilling | 179,284 | 127,912 | 307,196 | 179,284 | 127,912 | 307,196 |
| OVERALL | Production | 746,991 | 352,271 | 1,099,262 | 746,991 | 352,271 | 1,099,262 |
| OVERALL | OVERALL | 926,275 | 480,183 | 1,406,458 | 926,275 | 480,183 | 1,406,458 |
| Region | Function | Tier 1 | Tier 2 | ||||
|---|---|---|---|---|---|---|---|
| Onshore | Offshore | OVERALL | Onshore | Offshore | OVERALL | ||
| Africa | Drilling | 16,762 | 13,253 | 30,015 | 16,762 | 13,253 | 30,015 |
| Africa | Production | 130,438 | 36,688 | 167,126 | 130,438 | 36,688 | 167,126 |
| Africa | OVERALL | 147,200 | 49,941 | 197,141 | 147,200 | 49,941 | 197,141 |
| Asia / Australasia | Drilling | 21,527 | 43,702 | 65,229 | 21,527 | 43,702 | 65,229 |
| Asia / Australasia | Production | 114,293 | 126,118 | 240,411 | 114,293 | 126,118 | 240,411 |
| Asia / Australasia | OVERALL | 135,820 | 169,820 | 305,640 | 135,820 | 169,820 | 305,640 |
| Europe | Drilling | 9,521 | 15,597 | 25,118 | 9,521 | 15,597 | 25,118 |
| Europe | Production | 57,266 | 62,427 | 119,693 | 57,266 | 62,427 | 119,693 |
| Europe | OVERALL | 66,787 | 78,024 | 144,811 | 66,787 | 78,024 | 144,811 |
| Middle East | Drilling | 73,407 | 23,020 | 96,427 | 73,407 | 23,020 | 96,427 |
| Middle East | Production | 195,866 | 73,324 | 269,190 | 195,866 | 73,324 | 269,190 |
| Middle East | OVERALL | 269,273 | 96,344 | 365,617 | 269,273 | 96,344 | 365,617 |
| North America | Drilling | 19,711 | 13,818 | 33,529 | 19,711 | 13,818 | 33,529 |
| North America | Production | 149,964 | 10,100 | 160,064 | 149,964 | 10,100 | 160,064 |
| North America | OVERALL | 169,675 | 23,918 | 193,593 | 169,675 | 23,918 | 193,593 |
| Russia & Central Asia | Drilling | 10,287 | 3,791 | 14,078 | 10,287 | 3,791 | 14,078 |
| Russia & Central Asia | Production | 127,083 | 11,306 | 138,389 | 127,083 | 11,306 | 138,389 |
| Russia & Central Asia | OVERALL | 137,370 | 15,097 | 152,467 | 137,370 | 15,097 | 152,467 |
| South & Central America | Drilling | 44,178 | 17,386 | 61,564 | 44,178 | 17,386 | 61,564 |
| South & Central America | Production | 105,369 | 77,327 | 182,696 | 105,369 | 77,327 | 182,696 |
| South & Central America | OVERALL | 149,547 | 94,713 | 244,260 | 149,547 | 94,713 | 244,260 |
| OVERALL | Drilling | 195,393 | 130,567 | 325,960 | 195,393 | 130,567 | 325,960 |
| OVERALL | Production | 880,279 | 397,290 | 1,277,569 | 880,279 | 397,290 | 1,277,569 |
| OVERALL | OVERALL | 1,075,672 | 527,857 | 1,603,529 | 1,075,672 | 527,857 | 1,603,529 |
| Region | Function | Tier 1 | Tier 2 | ||||
|---|---|---|---|---|---|---|---|
| Onshore | Offshore | OVERALL | Onshore | Offshore | OVERALL | ||
| Africa | Drilling | 22,403 | 13,328 | 35,731 | 22,403 | 13,328 | 35,731 |
| Africa | Production | 136,907 | 42,802 | 179,709 | 136,907 | 42,802 | 179,709 |
| Africa | OVERALL | 159,310 | 56,130 | 215,440 | 159,310 | 56,130 | 215,440 |
| Asia / Australasia | Drilling | 7,342 | 42,770 | 50,112 | 7,342 | 42,770 | 50,112 |
| Asia / Australasia | Production | 115,617 | 117,043 | 232,660 | 115,617 | 117,043 | 232,660 |
| Asia / Australasia | OVERALL | 122,959 | 159,813 | 282,772 | 122,959 | 159,813 | 282,772 |
| Europe | Drilling | 15,135 | 17,600 | 32,735 | 15,135 | 17,600 | 32,735 |
| Europe | Production | 65,502 | 71,814 | 137,316 | 65,502 | 71,814 | 137,316 |
| Europe | OVERALL | 80,637 | 89,414 | 170,051 | 80,637 | 89,414 | 170,051 |
| Middle East | Drilling | 50,476 | 26,918 | 77,394 | 50,476 | 26,918 | 77,394 |
| Middle East | Production | 116,261 | 80,917 | 197,178 | 116,261 | 80,917 | 197,178 |
| Middle East | OVERALL | 166,737 | 107,835 | 274,572 | 166,737 | 107,835 | 274,572 |
| North America | Drilling | 24,187 | 15,787 | 39,974 | 24,187 | 15,787 | 39,974 |
| North America | Production | 166,896 | 12,517 | 179,413 | 166,896 | 12,517 | 179,413 |
| North America | OVERALL | 191,083 | 28,304 | 219,387 | 191,083 | 28,304 | 219,387 |
| Russia & Central Asia | Drilling | 6,985 | 5,454 | 12,439 | 6,985 | 5,454 | 12,439 |
| Russia & Central Asia | Production | 65,023 | 35,196 | 100,219 | 65,023 | 35,196 | 100,219 |
| Russia & Central Asia | OVERALL | 72,008 | 40,650 | 112,658 | 72,008 | 40,650 | 112,658 |
| South & Central America | Drilling | 26,452 | 20,052 | 46,504 | 26,452 | 20,052 | 46,504 |
| South & Central America | Production | 105,934 | 81,958 | 187,892 | 105,934 | 81,958 | 187,892 |
| South & Central America | OVERALL | 132,386 | 102,010 | 234,396 | 132,386 | 102,010 | 234,396 |
| OVERALL | Drilling | 152,980 | 141,909 | 294,889 | 152,980 | 141,909 | 294,889 |
| OVERALL | Production | 772,140 | 442,247 | 1,214,387 | 772,140 | 442,247 | 1,214,387 |
| OVERALL | OVERALL | 925,120 | 584,156 | 1,509,276 | 925,120 | 584,156 | 1,509,276 |
| Region | Function | Tier 1 | Tier 2 | ||||
|---|---|---|---|---|---|---|---|
| Onshore | Offshore | OVERALL | Onshore | Offshore | OVERALL | ||
| Africa | Drilling | 24,744 | 20,045 | 44,789 | 24,744 | 20,045 | 44,789 |
| Africa | Production | 132,727 | 45,392 | 178,119 | 132,727 | 45,392 | 178,119 |
| Africa | OVERALL | 157,470 | 65,437 | 222,907 | 157,470 | 65,437 | 222,907 |
| Asia / Australasia | Drilling | 22,405 | 53,378 | 75,784 | 22,405 | 53,378 | 75,784 |
| Asia / Australasia | Production | 129,433 | 140,233 | 269,666 | 129,433 | 140,233 | 269,666 |
| Asia / Australasia | OVERALL | 151,838 | 193,611 | 345,450 | 151,838 | 193,611 | 345,450 |
| Europe | Drilling | 14,972 | 16,052 | 31,024 | 14,972 | 16,052 | 31,024 |
| Europe | Production | 74,332 | 69,665 | 143,997 | 74,332 | 69,665 | 143,997 |
| Europe | OVERALL | 89,304 | 85,717 | 175,021 | 89,304 | 85,717 | 175,021 |
| Middle East | Drilling | 154,302 | 51,013 | 205,315 | 154,302 | 51,013 | 205,315 |
| Middle East | Production | 255,008 | 108,036 | 363,044 | 255,008 | 108,036 | 363,044 |
| Middle East | OVERALL | 409,310 | 159,049 | 568,359 | 409,310 | 159,049 | 568,359 |
| North America | Drilling | 41,071 | 16,166 | 57,237 | 41,071 | 16,166 | 57,237 |
| North America | Production | 177,140 | 17,736 | 194,876 | 177,140 | 17,736 | 194,876 |
| North America | OVERALL | 218,211 | 33,902 | 252,113 | 218,211 | 33,902 | 252,113 |
| Russia & Central Asia | Drilling | 8,883 | 5,372 | 14,255 | 8,883 | 5,372 | 14,255 |
| Russia & Central Asia | Production | 74,594 | 23,555 | 98,149 | 74,594 | 23,555 | 98,149 |
| Russia & Central Asia | OVERALL | 83,477 | 28,927 | 112,404 | 83,477 | 28,927 | 112,404 |
| South & Central America | Drilling | 26,317 | 32,355 | 58,672 | 26,317 | 32,355 | 58,672 |
| South & Central America | Production | 114,103 | 89,798 | 203,901 | 114,103 | 89,798 | 203,901 |
| South & Central America | OVERALL | 140,419 | 122,153 | 262,572 | 140,419 | 122,153 | 262,572 |
| OVERALL | Drilling | 292,694 | 194,382 | 487,076 | 292,694 | 194,382 | 487,076 |
| OVERALL | Production | 957,336 | 494,415 | 1,451,751 | 957,336 | 494,415 | 1,451,751 |
| OVERALL | OVERALL | 1,250,030 | 688,797 | 1,938,827 | 1,250,030 | 688,797 | 1,938,827 |
| Region | Function | Tier 1 | Tier 2 | ||||
|---|---|---|---|---|---|---|---|
| Onshore | Offshore | OVERALL | Onshore | Offshore | OVERALL | ||
| Africa | Drilling | 36,662 | 17,665 | 54,327 | 36,662 | 17,665 | 54,327 |
| Africa | Production | 191,191 | 45,319 | 236,509 | 191,191 | 45,319 | 236,509 |
| Africa | OVERALL | 227,853 | 62,984 | 290,836 | 227,853 | 62,984 | 290,836 |
| Asia / Australasia | Drilling | 89,596 | 80,186 | 169,782 | 89,596 | 80,186 | 169,782 |
| Asia / Australasia | Production | 163,350 | 132,104 | 295,454 | 163,350 | 132,104 | 295,454 |
| Asia / Australasia | OVERALL | 252,947 | 212,289 | 465,236 | 252,947 | 212,289 | 465,236 |
| Europe | Drilling | 14,395 | 16,506 | 30,901 | 14,395 | 16,506 | 30,901 |
| Europe | Production | 65,694 | 69,435 | 135,129 | 65,694 | 69,435 | 135,129 |
| Europe | OVERALL | 80,089 | 85,941 | 166,030 | 80,089 | 85,941 | 166,030 |
| Middle East | Drilling | 145,565 | 53,776 | 199,340 | 145,565 | 53,776 | 199,340 |
| Middle East | Production | 294,318 | 106,255 | 400,573 | 294,318 | 106,255 | 400,573 |
| Middle East | OVERALL | 439,883 | 160,031 | 599,914 | 439,883 | 160,031 | 599,914 |
| North America | Drilling | 51,176 | 15,480 | 66,656 | 51,176 | 15,480 | 66,656 |
| North America | Production | 210,611 | 14,389 | 225,001 | 210,611 | 14,389 | 225,001 |
| North America | OVERALL | 261,787 | 29,870 | 291,657 | 261,787 | 29,870 | 291,657 |
| Russia & Central Asia | Drilling | 8,820 | 3,962 | 12,782 | 8,820 | 3,962 | 12,782 |
| Russia & Central Asia | Production | 89,013 | 21,588 | 110,601 | 89,013 | 21,588 | 110,601 |
| Russia & Central Asia | OVERALL | 97,833 | 25,550 | 123,383 | 97,833 | 25,550 | 123,383 |
| South & Central America | Drilling | 29,599 | 39,104 | 68,703 | 29,599 | 39,104 | 68,703 |
| South & Central America | Production | 140,046 | 88,343 | 228,389 | 140,046 | 88,343 | 228,389 |
| South & Central America | OVERALL | 169,644 | 127,447 | 297,091 | 169,644 | 127,447 | 297,091 |
| OVERALL | Drilling | 375,812 | 226,679 | 602,491 | 375,812 | 226,679 | 602,491 |
| OVERALL | Production | 1,154,223 | 477,432 | 1,631,655 | 1,154,223 | 477,432 | 1,631,655 |
| OVERALL | OVERALL | 1,530,035 | 704,111 | 2,234,146 | 1,530,035 | 704,111 | 2,234,146 |
Section 8 Company results
| Company code | Tier 1 PSE rate | Tier 2 PSE rate |
|---|---|---|
| HP | 0.76 | 0.76 |
| EA | 0.45 | 1.64 |
| TY | 0.42 | 0.00 |
| EM | 0.41 | 0.21 |
| HY | 0.30 | 0.83 |
| QG | 0.28 | 0.83 |
| SJ | 0.25 | 0.51 |
| SW | 0.24 | 0.86 |
| MO | 0.24 | 0.24 |
| LI | 0.23 | 0.83 |
| XU | 0.18 | 0.00 |
| PW | 0.16 | 0.16 |
| HL | 0.14 | 0.14 |
| UT | 0.11 | 1.40 |
| SP | 0.10 | 0.31 |
| VV | 0.09 | 0.00 |
| TM | 0.08 | 0.17 |
| OJ | 0.08 | 0.16 |
| YT | 0.08 | 0.15 |
| OH | 0.07 | 0.55 |
| VM | 0.07 | 0.22 |
| RY | 0.07 | 0.05 |
| TJ | 0.05 | 1.11 |
| KO | 0.05 | 0.14 |
| QX | 0.04 | 0.38 |
| IC | 0.04 | 0.08 |
| LT | 0.02 | 0.12 |
| XT | 0.02 | 0.10 |
| QC | 0.02 | 0.04 |
| KH | 0.00 | 3.51 |
| YD | 0.00 | 0.47 |
| FA | 0.00 | 0.40 |
| JE | 0.00 | 0.28 |
| KR | 0.00 | 0.22 |
| NA | 0.00 | 0.13 |
| NY | 0.00 | 0.10 |
| BE | 0.00 | 0.00 |
| BN | 0.00 | 0.00 |
| BY | 0.00 | 0.00 |
| CI | 0.00 | 0.00 |
| EJ | 0.00 | 0.00 |
| PE | 0.00 | 0.00 |
| QW | 0.00 | 0.00 |
| RQ | 0.00 | 0.00 |
| TX | 0.00 | 0.00 |
| UH | 0.00 | 0.00 |
| UU | 0.00 | 0.00 |